
Fig. 4.
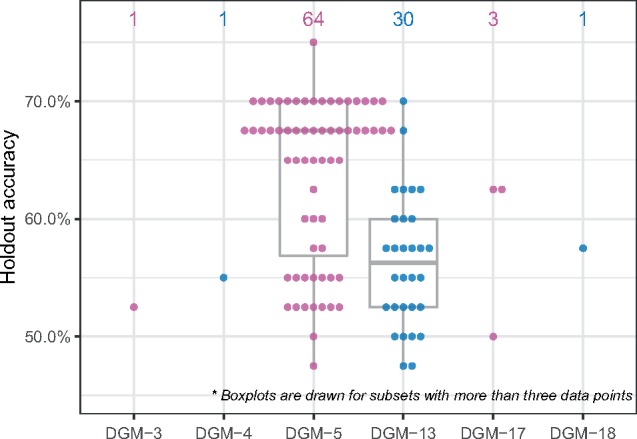
TPOT-FSS’s holdout accuracy (vertical) with selected subset (horizontal) in 100 replications on the RNA-Seq data. Number of pipeline inclusions of each subset is displayed above the boxplots. Subsets DGM-5 and DGM-13 are the most frequent to be included in the final pipeline. Pipelines that include DGM-5, on average, produce higher MDD prediction accuracies in the holdout set