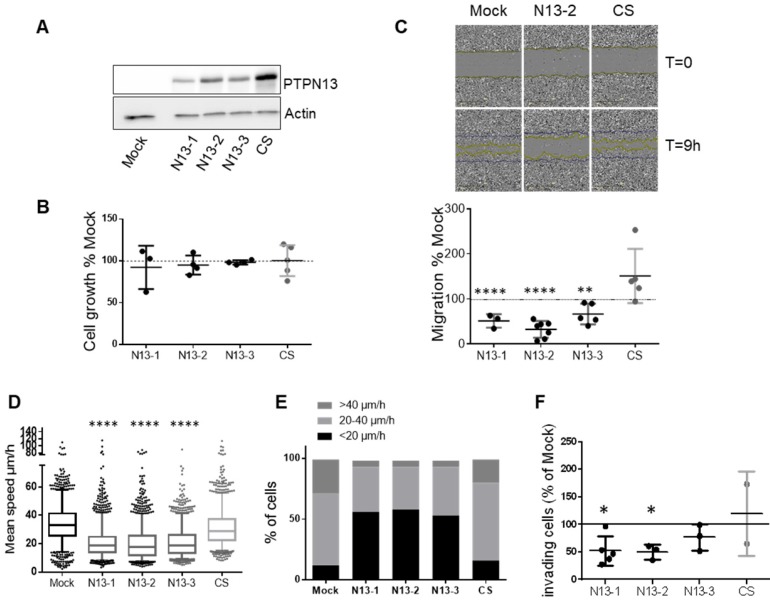
Figure 4.
PTPN13 regulates MDA-MB-231 cell motility and invasiveness. A: Expression of wt (N13-1, N13-2, N13-3) or catalytically inactive (CS) PTPN13 in the indicated cell clones was monitored by western blotting using anti-PTPN13 antibodies. Mock: control cells (vector alone); equal loading was verified by re-probing with an anti-actin antibody. B: Cell growth measured using the MTS assay. Results, expressed as % of Mock cells, are the mean ± s.d. of three (N13-1) four (N13-2, N13-3) or five (Mock, CS) independent experiments. C: Directional migration was assessed with the wound healing assay. C. Upper panel: Phase-contrast optical photomicrographs of the wounded area at 0 and 9h. C. Lower panel: Quantification of cell migration, expressed as % of Mock cells; mean ± s.d. of 3 (N13-1) or ≥5 (Mock, N13-2, N13-3, CS) independent experiments. **P<0.01, ****P<0.0001 versus Mock. D: Individual migration of the indicated cell clones was monitored by video microscopy and cell tracking on duplicate wells in three independent experiments. Graph represents the speed of about 1500 cells for each clone, Box-plot whiskers represent the 5 and 95 percentile values; ****P<0.0001 versus Mock and CS. E: Classification of cells (percentage) according to their migration speed (as in panel E): slow (<20µm/h), medium (20 to 40µm/h) and fast (>40µm/h). F: Cell invasiveness was evaluated with the Boyden chamber test. The percentage of cells that migrated through Matrigel-coated filters was quantified relative to the total number of seeded cells. Results, expressed as % of Mock cells, are the mean ± s.d. of five (N13-1), three (N13-2, N13-3) or two (CS) independent experiments *P<0.05 versus Mock. (C, D and F) two-tailed Student's t-test.

