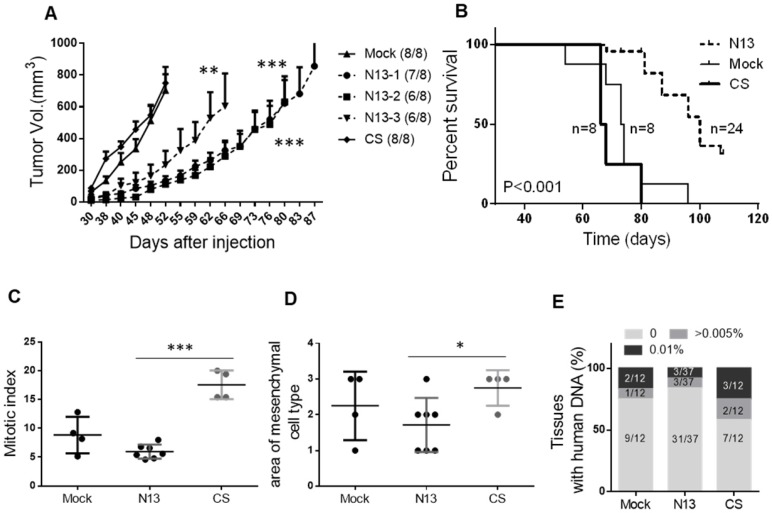
Figure 5.
PTPN13 phosphatase activity delays MDA-MB-231 breast cancer cell xenograft growth in the mammary fat pad and invasiveness. 106 N13-1, N13-2, N13-3, CS, or control (Mock) cells were injected in the mammary fat pad of 8-week-old female immunodeficient mice. A: Tumor growth was measured twice/week and mice were sacrificed when tumor reached 1500mm3. The curve shows the tumor size (mean ± s.e.m.) over time in mice that developed a tumor within 90 days post-injection (numbers in brackets); the curve stops when the first mouse in each group is sacrificed. *** P<0.001, **P<0.01 versus Mock (ANOVA from day 30 to day 52) B: Kaplan-Meier analysis of survival (event: tumors reaching 1500mm3). The curves were drawn and analyzed using the Prism software. P value obtained using the log rank test. The number of animals in each group (n) is shown. Mitotic index (C) and area of tumor mesenchymal cell type (D), expressed as the mean ± s.d., in Mock and CS cell-derived (n=4) and N13 cell-derived tumors (n=7), *** P<0.001, *P<0.05 (two-tailed Student's t-test). E: Micro-metastasis detection by PCR. Data represent the percentage of mouse tissue (lung and liver) DNA samples containing also human DNA. The number of tissues tested is shown in brackets.

