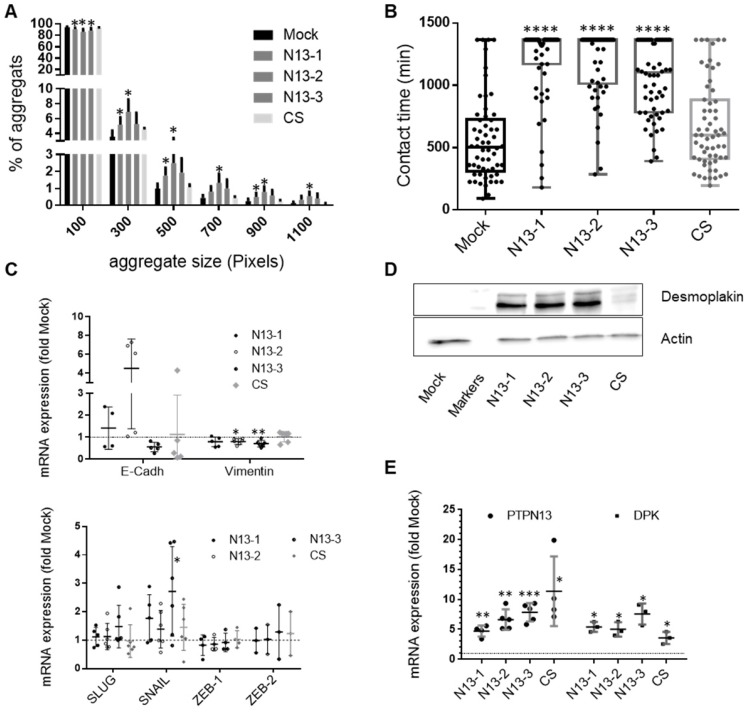
Figure 7.
PTPN13 stabilizes intercellular adhesion. A: Cell-cell adhesion was evaluated in MDA-MB-231-derived clones using a 3D cell aggregation assay. The percentage of each aggregate size class was calculated and plotted using the Prism software. A 100 pixel surface corresponds approximately to three cells. Results are the mean ± s.d. of four independent experiments. *P<0.05 versus Mock. B: Cell-cell adhesion stability was evaluated by video monitoring. The mean contact time between cells (in minutes) was calculated, and values (n>55) were plotted. Box-plot whiskers represent the minimum and maximum values; ****P<0.0001 versus Mock. Note that in N13 cultures, many cells remained in contact during the whole experiment, explaining the lack of upper whiskers and mean values for these clones. C: Expression of EMT master genes evaluated by RT-qPCR. Data were normalized to HPRT levels and are the mean ± s.d. mRNA levels relative to those in Mock cells (n≥5 experiments for SLUG, SNAIL and vimentin; n≥4 for E-cadherin and ZEB-1, and n= 3 for ZEB-2). *P<0.05, **P<0.01 versus Mock. D: Desmoplakin expression in the indicated cell clones was monitored by western blotting with actin as loading control. E: PTPN13 and desmoplakin expression evaluated by RT-qPCR and normalized to that of HPRT. Data are expressed relative to Mock cells, and are the mean ± s.d. (n≥3 for DPK, n≥4 for PTPN13. *P<0.05, **P<0.01, ***P<0.001 versus Mock. (A, B, C and E) two-tailed Student's t-test.

