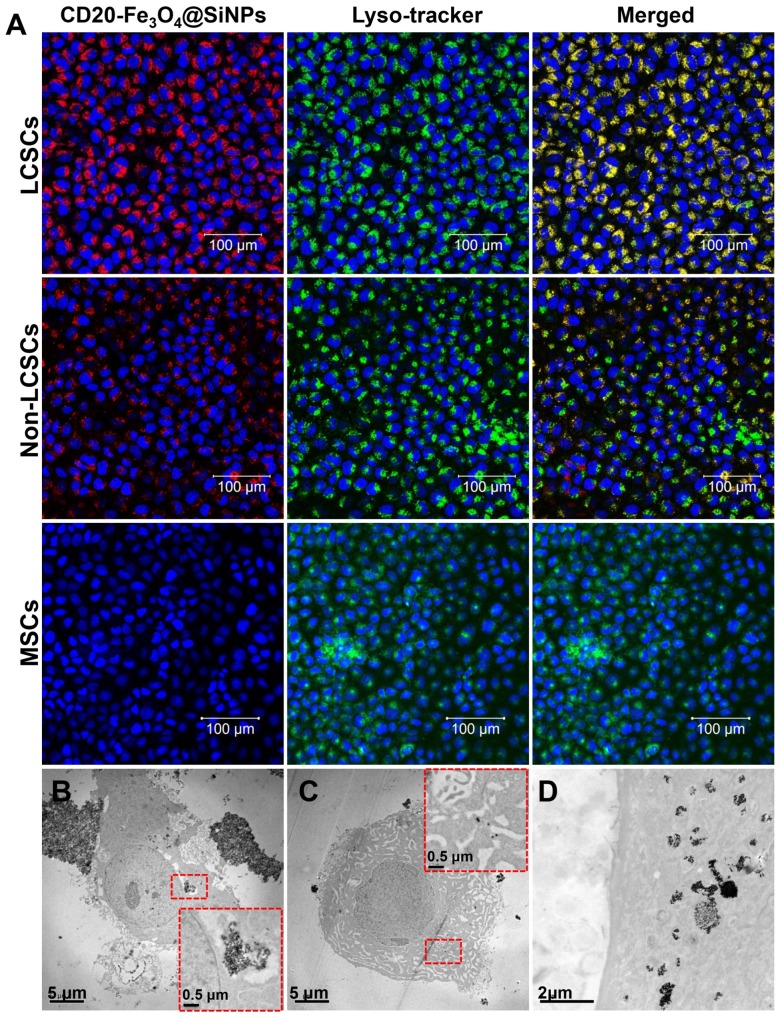
Figure 3.
In vitro cellular uptake and internalization of CD20-Fe3O4@SiNPs by LCSCs, non-LCSCs, and MSCs. (A) Confocal images of cells treated with CD20-Fe3O4@SiNPs for 1 h. TEM images showed the internalization of (B) CD20-Fe3O4@SiNPs, (C) Fe3O4@SiNPs by LCSCs. (D) Subcellular localization of CD20-Fe3O4@SiNPs in LCSCs.

