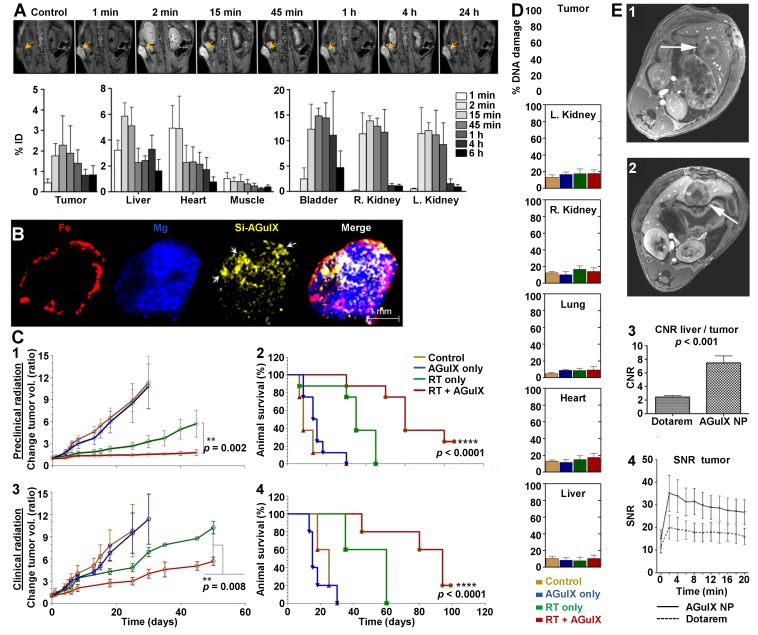
Figure 4.
Studies of AGuIX® NPs on pancreatic and hepatic colorectal rodent cancer models. A. Whole body MRI and blood plasma kinetics in mice. T1-weighted MRI (7 T) of AGuIX® NPs (0.25 mg/g) injected in mice bearing capan-1-pancreatic tumors (n = 3/group) showed early tumor discrimination (at 1 min p.i.) followed by increasing accumulation. Maximum tumor accumulation of AGuIX®NPs occurs at 15 min p.i.. Some accumulation in the liver (~6% ID) was also observed. All data are represented as the means ± standard deviation. B. Intratumoral AGuIX® NP localization in capan-1 tumor at 15 min p.i. imaged using LIBS. C. Tumor volume measurements (1, 3) and therapeutic effect assessments (2, 4) on capan-1-tumor-bearing mice treated with and without AGuIX® NP and preclinical (220 kV, n = 8/group, 1, 2) or clinical (6 MV, n = 5/group, 3, 4) radiation (10 Gy). The tumor volume is significantly decreased and the Kaplan-Meier survival curves demonstrate significant survival benefit when AGuIX® NP is included with both preclinical and clinical radiation. Statistical significance was calculated using the log-rank (Mantel-Cox) test. D. Preclinical radiation-induced DNA damage studies. γH2AX+ nuclei were counted across multiple image planes (n = 50) and further quantified. The data are represented as the means ± standard deviation. ****: p < 0.0001. E. T1‐weighted axial image in a rat with a hepatic colorectal cancer metastasis (diameter approximately 8 mm, arrows) after administration of Dotarem® (1) and AGuIX® NP (2) (0.1 mmol/kg [Gd3+] in both case). Post‐contrast images with AGuIX® NP better depict the mass relative to Dotarem® as is evident from the greater contrast‐to‐noise ratio (CNR, 3) between normal liver tissue and the metastasis. AGuIX® NP demonstrates kinetics comparable to a low‐molecular contrast agent (4). SNE: signal-to-noise ratio. Adapted with permission from ref 38, 46, copyrights 2019 Elsevier and John Wiley and Sons.

