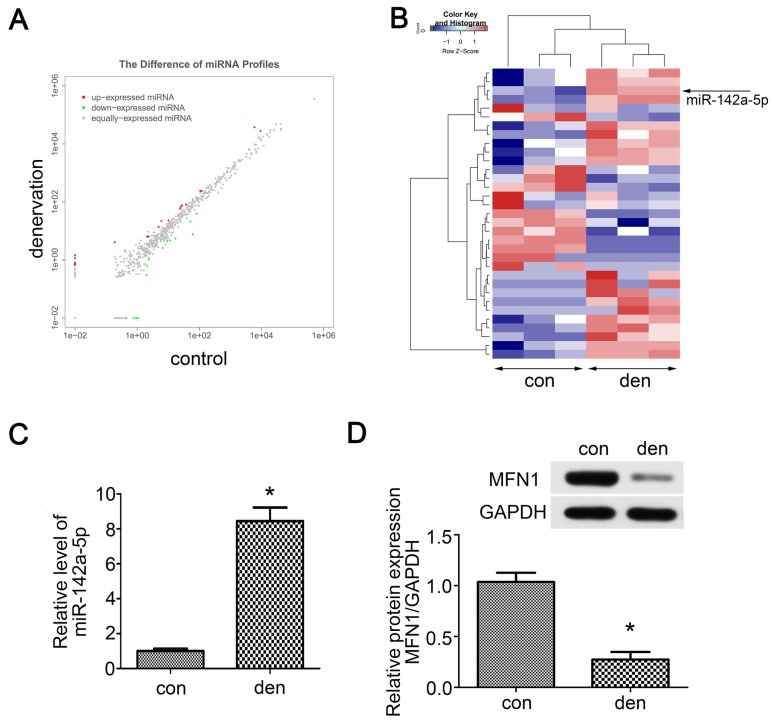
Figure 2.
Small RNA sequencing and target predicting. (A) Scatter plot of miRNAs expression in denervated and contralateral gastrocnemius two weeks post-operation. The red and green point in the plot represented the differentially expressed miRNAs showing statistical significance (P < 0.05). (B) Hierarchical cluster analysis of the significantly upregulated and downregulated miRNAs (P < 0.05). Each column represented a sample and each row represented a miRNA. The expression levels were presented in different colors indicating expression levels above and below the median expression level across all samples. miR-142a-5p was marked by arrow. (C) qRT-PCR was performed to verify the small RNA sequencing results of miR-142a-5p in gastrocnemius of contralateral side and denervation side. (D) MFN1, the predicted target of miR-142a-5p, was detected by western blot. Data were presented as mean ± SD. n=3. *P < 0.05 vs contralateral side. Den, denervation; Con, control.

