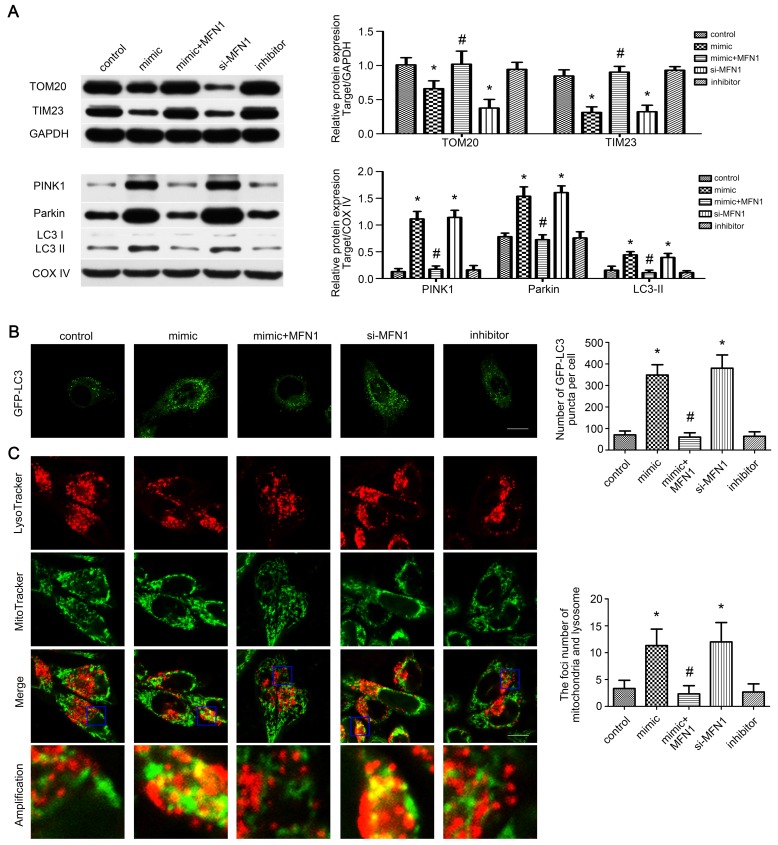
Figure 5.
miR-142a-5p/MFN1 axis activated mitophagy in vitro. (A) Western blotting analysis of the mitophagy parameters in C2C12 cells. The expressions of total TOM20, TIM23 and mito-PINK1, Parkin, LC3II were evaluated separately. GAPDH and COX IV were used as internal references. (B) Representative images of C2C12 cells expressing GFP-LC3 in each group. Quantification of the average number of GFP-LC3 puncta per cell. Scale bar 10 µm. (C) Co-staining of mitochondria and lysosome by MitoTracke Green and LysoTracker Red. Part of the photographs (blue box) were amplified. The number of the overlaps between the mitochondria and lysosome was counted to quantify the mitophagy activity. Scale bar 10 µm. Data were presented as mean ± SD. *P < 0.05 vs control. #P < 0.05 vs mimic.

