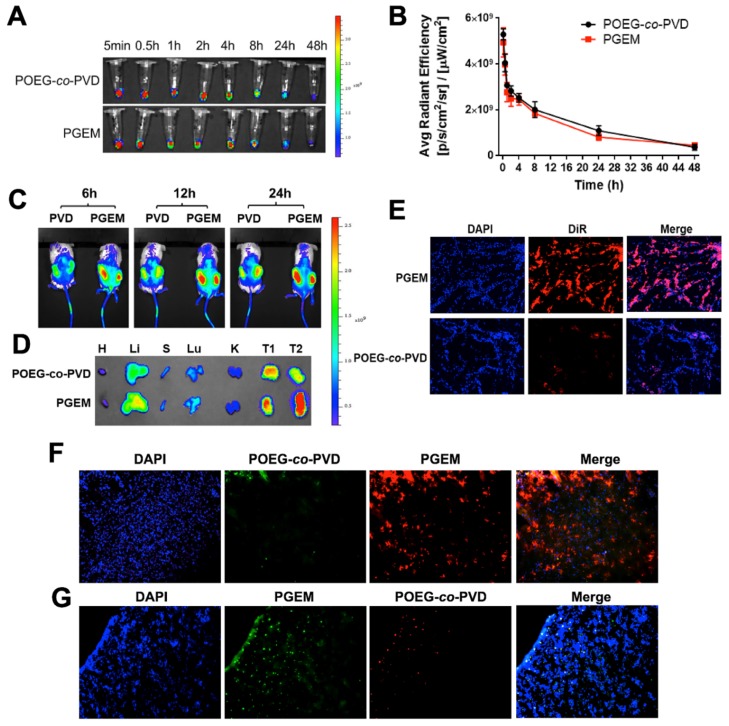
Figure 3.
Pharmacokinetics, biodistribution and tumor penetration of PGEM carrier (15 nm NPs) with POEG-co-PVD carrier (160 nm NPs) as a control. (A) The representative NIR images and (B) quantitative measurements of DiR/ PGEM and DiR/POEG-co-PVD in the blood. (C) In vivo NIR imaging of the PDX tumor-bearing mice treated with DiR-labeled POEG-co-PVD and PGEM micelles at different time points. (D) Ex vivo NIR images of major organs and tumors of each mouse treated with DiR-labeled POEG-co-PVD and PGEM respectively at 24 h. (E) Fluorescence images of tumor sections at 24 h after treatment with DiR-loaded POEG-co-PVD and PGEM micelles, respectively. (F-G) Fluorescence images of tumor sections at 15 h after treatment with (F) the mixture solution of fluorescein-labeled POEG-co-PVD (green, 160 nm NPs) and rhodamine-labeled PGEM (red, 15 nm NPs); (G) the mixture solution of fluorescein- labeled PGEM and rhodamine-labeled POEG-co-PVD NPs.

