Figure 3.
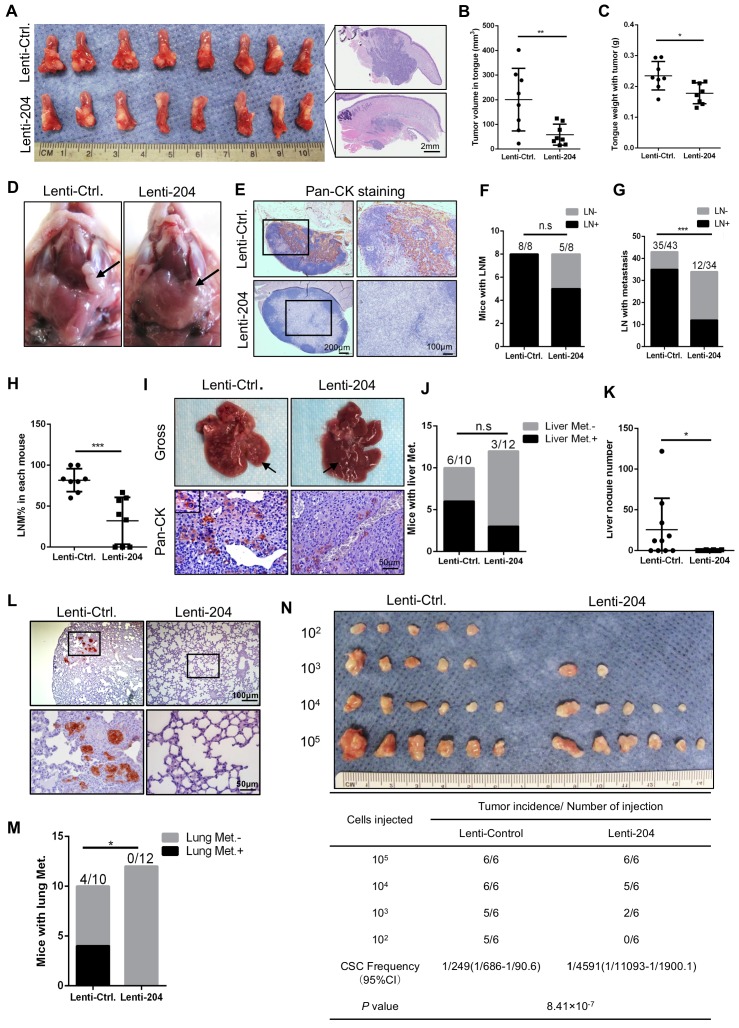
MiR-204-5p inhibits tumor growth, metastasis and tumorigenesis of HNSCC in vivo. (A) Representative image of HNSCC orthotopic xenograft inoculated with the indicated cells and histopathological analysis of the tumor (n=8 per group). Tumor volume (B) and weight (C) were inhibited in mice bearing miR-204-5p overexpressing cells as compared to mice bearing control cells. *P < 0.05 and **P < 0.01 by Student's t test. (D) Representative image of cervical lymph node from mice bearing miR-204-5p overexpressing cancer cells and their corresponding control cells. (E) Representative image of cervical lymph node examined by Pan-CK staining. (F) The percentage of mice having lymph node metastasis was analyzed by Fisher's exact test. n.s indicates non-significant. (G) The percentage of lymph node with metastatic tumor cells was analyzed by Fisher's exact test. ***P < 0.001. (H) The percentage of lymph node with metastatic tumor cells in each mouse. ***P < 0.001 by Student's t test. (I) Representative image of liver metastasis in nude mice inoculated with the indicated cells. Pan-CK staining was used to detect the metastatic tumor cells. (J) The percentage of mice with liver metastasis was analyzed by Fisher's exact test. n.s indicates non-significant. (K) The liver nodule number was analyzed in nude mice inoculated with miR-204-5p overexpressing cells and control cells. n=10-12 *P < 0.05 by Student's t test. (L) Representative image of lung metastasis examined by pan-CK staining. (M) The percentage of mice with lung metastasis was analyzed by Fisher's exact test. n=10-12. *P < 0.05. (N) In vivo limiting dilution analysis of HNSCC cells transfected with miR-204-5p. The frequency of allograft formation at each cell dose injected is shown.

