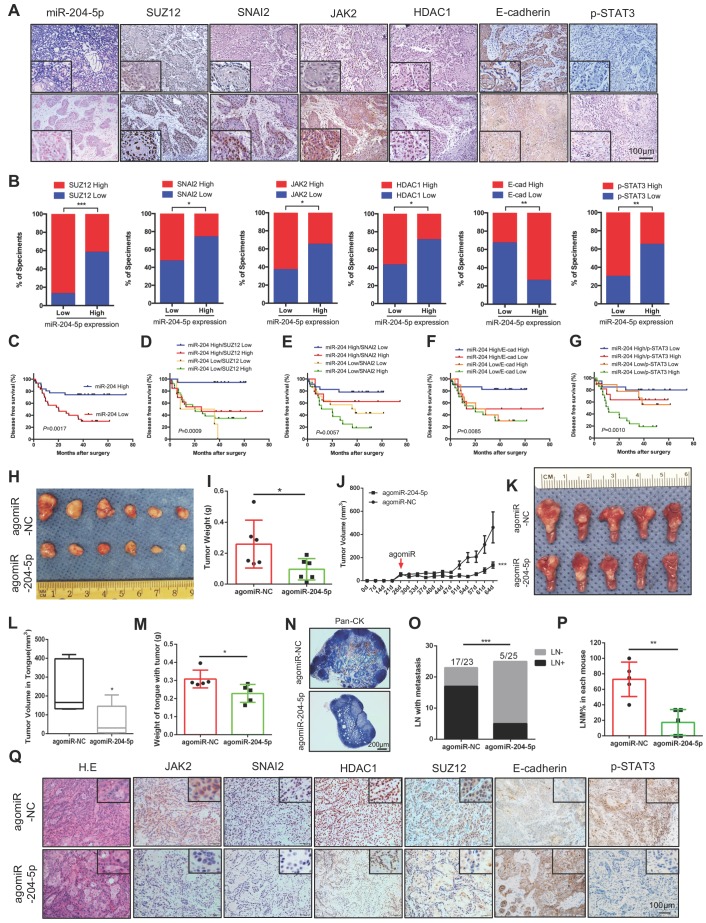
Figure 7.
Decrease of miR-204-5p indicates a poor prognosis and agomiR-204-5p inhibits tumor progression in PDX model. (A) Representative image of ISH and IHC analysis of miR-204-5p, SUZ12, SNAI2, JAK2,HDAC1, E-cadherin, and p-STAT3 in HNSCC samples. (B) Percentage of specimens showing low or high miR-204-5p expression in relation to the expression levels of SUZ12, SNAI2, JAK2,HDAC1, E-cadherin, and p-STAT3.The Chi square test was used to analyze statistical significance. (C) Kaplan-Meier curves for survival of patients with HNSCC that grouped by the expression of miR-204-5p. Kaplan-Meier analyses for survival of patients with HNSCC that have expression levels of miR-204-5p high or low combined with SUZ12 (D), SNAI2 (E), E-cadherin (F), and p-STAT3 (G) high or low. P values of Kaplan-Meier analyses were calculated using log-rank and Gehan-Breslow-Wilcoxon tests. (H) Image of subcutaneous HNSCC PDX treated with agomiR-204-5p and agomiR-NC. Quantitative mass of tumors (I) and tumor growth kinetics (J) from HNSCC PDX treated with AgomiR-204-5p and agomiR-NC. Values are mean ± SD. n=6. *P < 0.05 by Student's t test. ***P < 0.001 by two-way ANOVA. (K) Image of orthotopic PDX treated with agomiR-204-5p and agomiR-NC. Quantitative of tumor volume (L) and tongue weight with tumor (M) from orthotopic PDX treated with agomiR-204-5p and agomiR-NC. (N) Representative image of pan-CK staining in lymph node. (O) The percentage of lymph node with metastatic tumor cells was analyzed by Fisher's exact test. ***P < 0.001. (P) The percentage of lymph node with metastatic tumor cells in each mouse. **P < 0.01 by Student's t test. (Q) Representative image of H.E and IHC staining for miR-204-5p related genes from subcutaneous HNSCC PDX treated with agomiR-204-5p and agomiR-NC. E-cad: E-cadherin.

