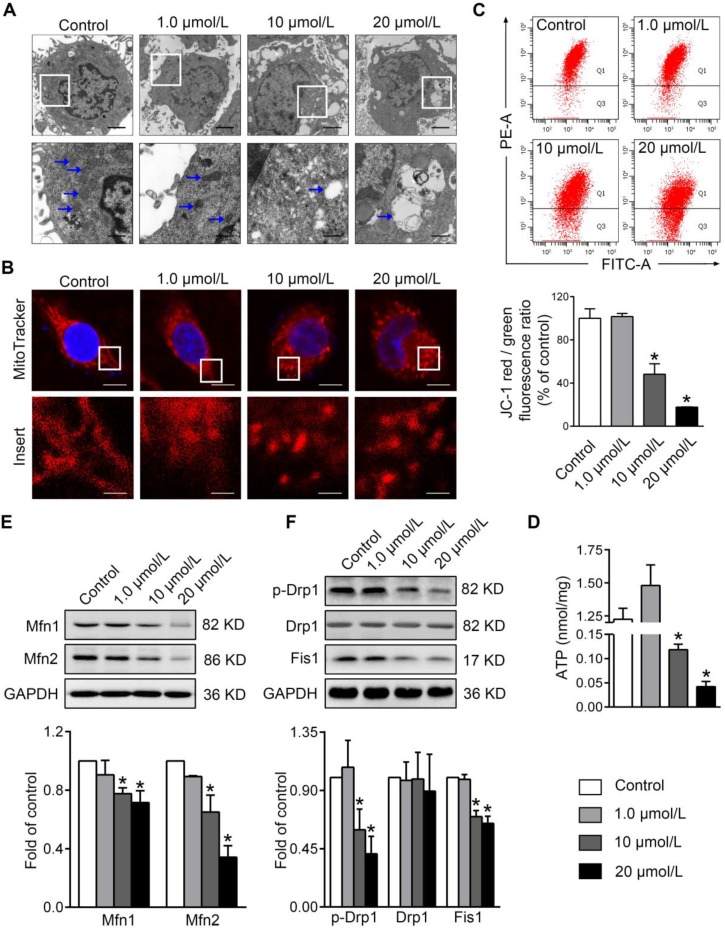
Figure 1.
PBDE-47 induces abnormal mitochondrial morphology and function as well as disturbed mitochondrial dynamics in PC12 cells. PC12 cells were treated with different concentrations of PBDE-47 (1.0, 10, 20 μmol/L) or DMSO for 24 h. (A) Representative TEM images of PC12 cells. Scale bars, 2 μm (top panel), 500 nm (bottom panel); white arrows, mitochondrion. (B) Representative confocal images of mitochondrial morphology in PC12 cells. Scale bars, 10 μm (top panel), 2 nm (bottom panel); Red, MitoTracker Deep Red probe staining; blue, DAPI staining. (C) Representative flow cytometry plots and quantification of MMP. (D) Intracellular ATP levels of PC12 cells. (E, F) Representative western blotting and quantification of mitochondrial dynamics proteins. Results are expressed as mean ± SD of three separate experiments. *P < 0.05 versus control group.

