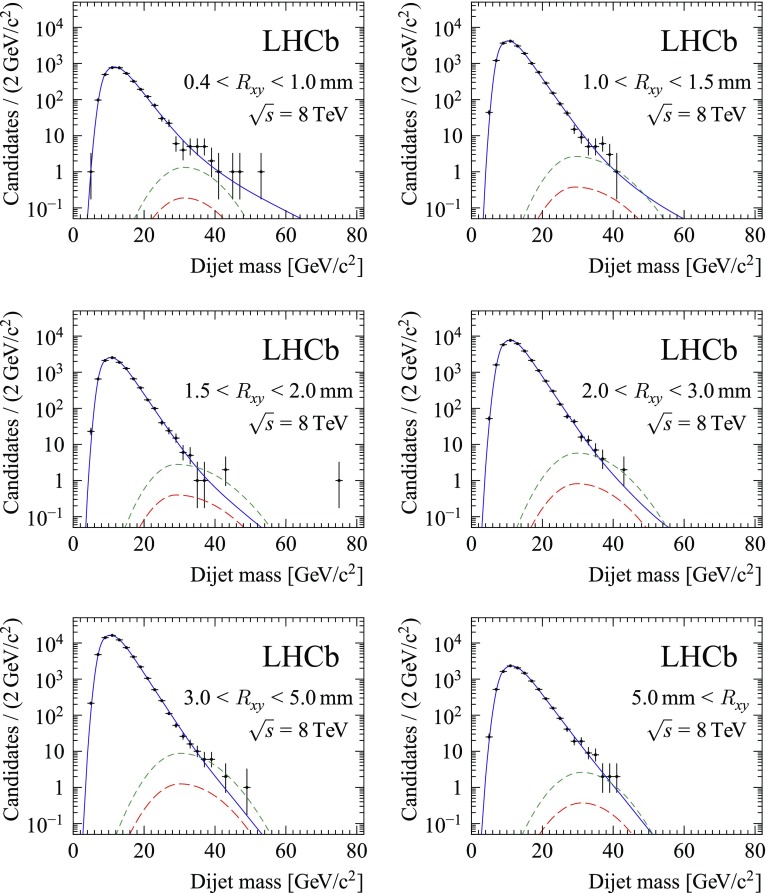
Fig. 2.
Dijet invariant mass distribution in the different bins, for the 2012 data sample. For illustration, the best fit with a signal model with mass 35 and lifetime 10 ps is overlaid. The solid blue line indicates the total background model, the short-dashed green line indicates the signal model for signal strength , and the long-dashed red line indicates the best-fit signal strength

