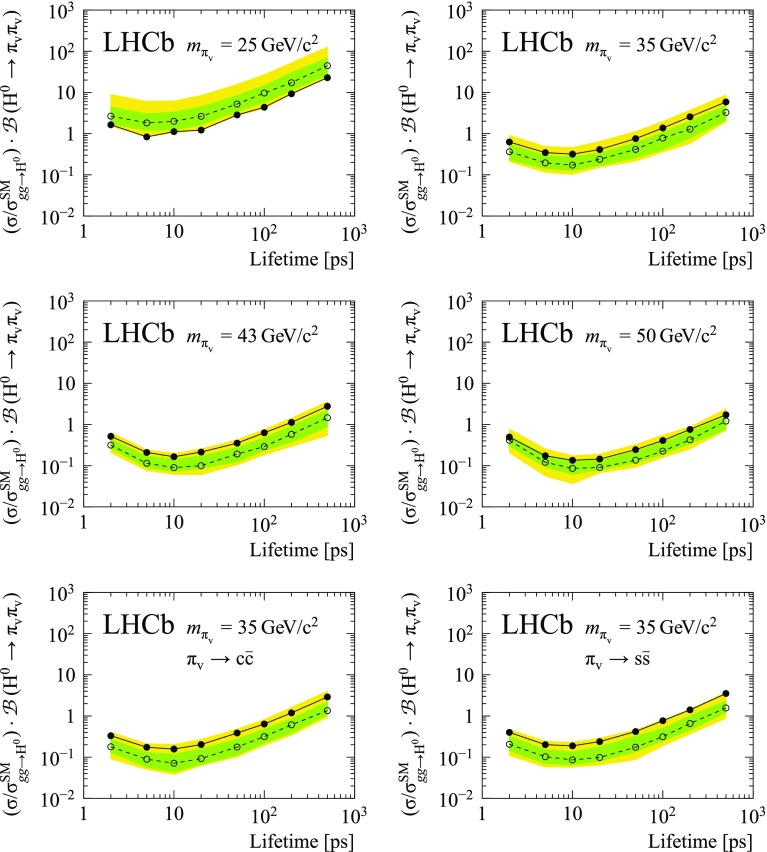
Fig. 3.
Expected (open circles and dotted line) and observed (filled circles and solid line) upper limit versus lifetime for different masses and decay modes. The green (dark) and yellow (light) bands indicate the quantiles of the expected upper limit corresponding to and for a Gaussian distribution. The decay is assumed, unless specified otherwise

