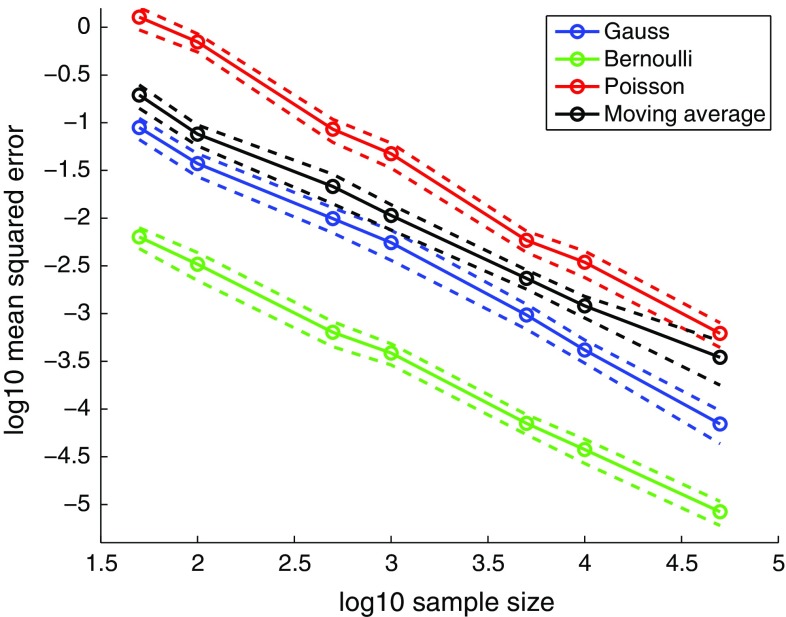
Fig. 3.
Empirical evidence for consistency. The figure shows the mean squared estimation error for the examples in Fig. 2 as a function of the sample size n (solid lines, circles). The mean was computed as an average over 100 outcomes. The dashed lines depict the mean ±2 standard errors. The linear trend on the log–log scale suggests convergence in quadratic mean, and hence consistency of the estimator . The results are for -regularized logistic regression, see Supplementary material 3 for the other classification methods

