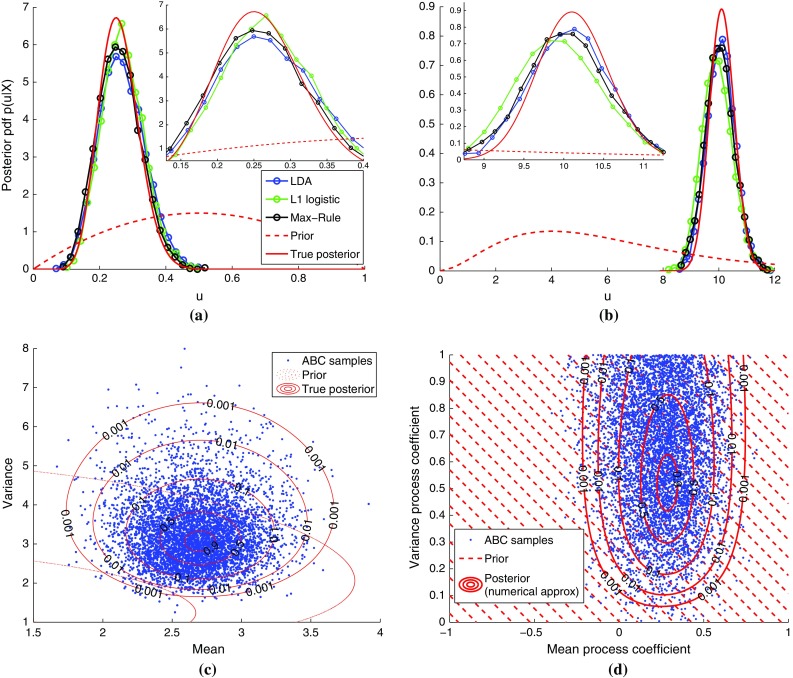
Fig. 4.

Posterior distributions inferred by classifier ABC for binary, count, continuous, and time series data. The results are for 10,000 ABC samples and . For the univariate cases, the samples are summarized as empirical pdfs. For the bivariate cases, scatter plots of the obtained samples are shown (the results are for the max-rule). The numbers on the contours are relative to the maximum of the reference posterior. For the autoregressive conditional heteroskedasticity (ARCH) model, the hatched area indicates the domain of the uniform prior. Supplementary material 4 contains additional examples and results. a Binary data (Bernoulli), b count data (Poisson), c continuous data (Gauss), and d time series (ARCH)
