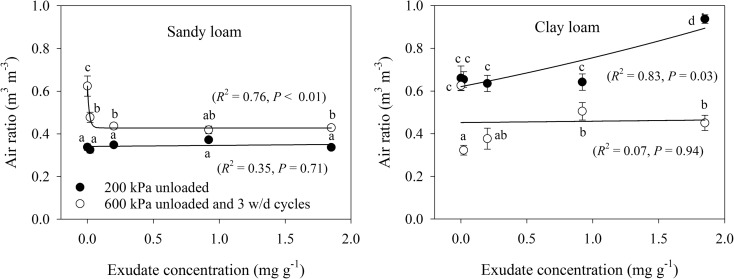
Fig. 5.
Air ratio relationship to exudate concentration for sandy loam and clay loam soils for (i) 200 kPa loading, (ii) 600 kPa loading and (iii) 600 kPa loading with wetting and drying. Error bars represent ±1 s.e.m. (n = 5). Different lowercase letters show a significant difference (P < 0.05) between either exudate concentration or stages of the compression cycle

