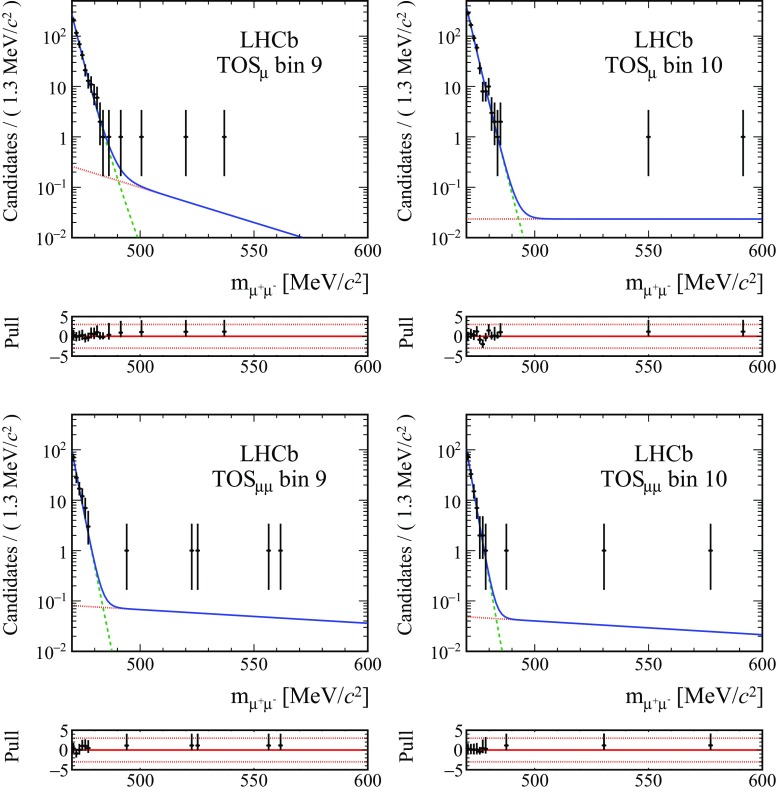
Fig. 2.
Fits to the reconstructed kaon mass distributions, for the two most sensitive bins in the two trigger categories, TOS and TOS. The fitted model is shown as the solid blue line, while the combinatorial background and double misidentification are overlaid with dotted red and dashed green lines, respectively. For each fit, the pulls are shown on the lower smaller plots

