
Fig. 29.
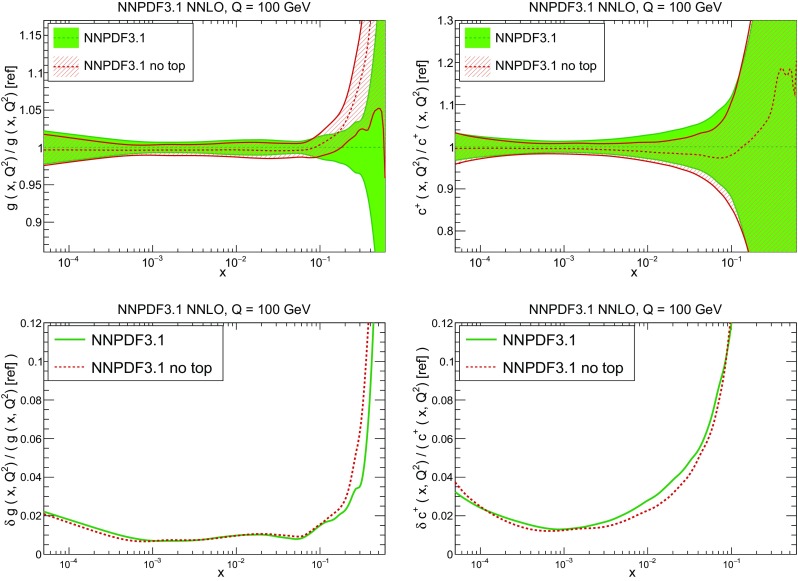
Same as Fig. 25 but now excluding all top data (total cross-sections and differential distributions). Results are shown for the gluon (left) and charm (right), the PDFs above and their uncertainties below
Official websites use .gov
A
.gov website belongs to an official
government organization in the United States.
Secure .gov websites use HTTPS
A lock (
) or https:// means you've safely
connected to the .gov website. Share sensitive
information only on official, secure websites.
Same as Fig. 25 but now excluding all top data (total cross-sections and differential distributions). Results are shown for the gluon (left) and charm (right), the PDFs above and their uncertainties below