
Fig. 34.
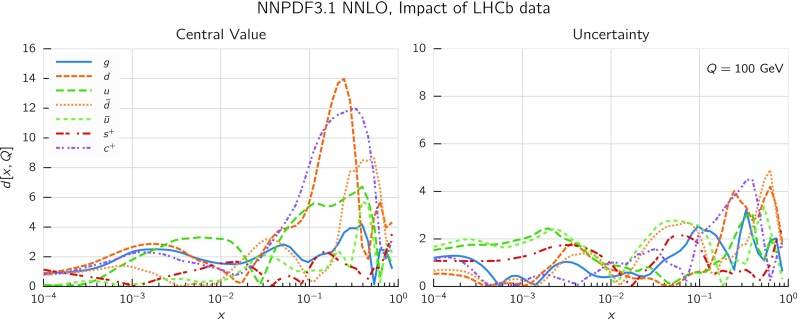
Same as Fig. 24 but now excluding all LHCb data. Note the different scale on the y axis in the left plot
Official websites use .gov
A
.gov website belongs to an official
government organization in the United States.
Secure .gov websites use HTTPS
A lock (
) or https:// means you've safely
connected to the .gov website. Share sensitive
information only on official, secure websites.
Same as Fig. 24 but now excluding all LHCb data. Note the different scale on the y axis in the left plot