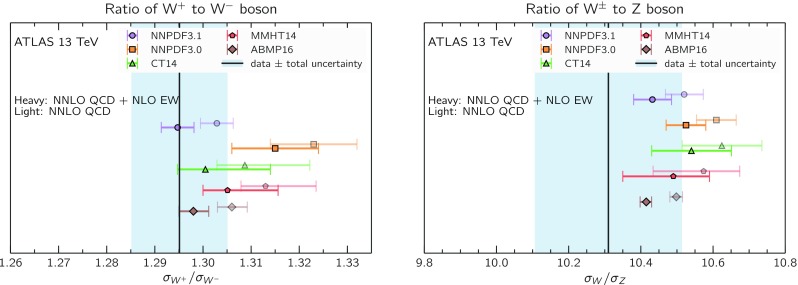
Fig. 68.

Comparison of the ATLAS measurements of the ratio (left) and the W / Z ratio (right) at TeV with theoretical predictions computed with different NNLO PDF sets. Predictions are shown with (heavy) and without (light) NLO EW corrections computed with FEWZ and HORACE, as described in the text
