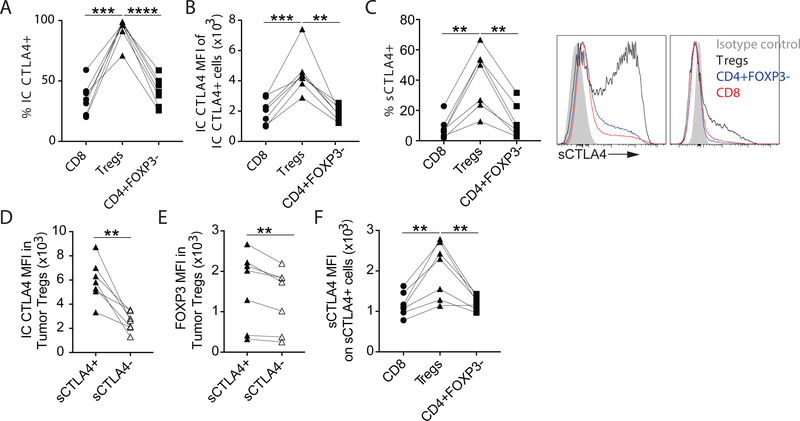
Figure 2.
Expression of sCTLA4 of T cell subsets infiltrating patient-derived NSCLC tissue.
Single cell suspensions from fresh patient-derived NSCLC tissue were analyzed by flow cytometry. (A) Graph shows the frequency of intratumoral CD8, Tregs (CD4+FOXP3+) and CD4+FOXP3- T cells (Live CD45+CD20-CD14-CD11c-CD66b-CD3+) expressing intracellular (IC) CTLA4. (B) Graph shows the level of IC CTLA4 expression by the IC CTLA4+ fraction of these intratumoral T cell subsets. (C) Left, graph shows the frequency of intratumoral CD8, Tregs and CD4+FOXP3- T cells expressing surface CLTA4 (sCTLA4). Right, Representative histograms of the two types of sCTLA4 expression patterns seen (Tregs, black histogram; CD4+FOXP3-, blue histogram; CD8+, red histogram). (D-E) Graphs show the level of IC CTLA4 (D) and FOXP3 (E) expression by sCTLA4+ and sCTLA4- intratumoral Tregs. (F) Graph shows the level of sCTLA4 expression by the sCTLA4+ fraction of these intratumoral T cell subsets. To determine statistical significance paired t-tests were used. ** indicates p < 0.01, p indicates < 0.001, **** indicates p < 0.0001.

