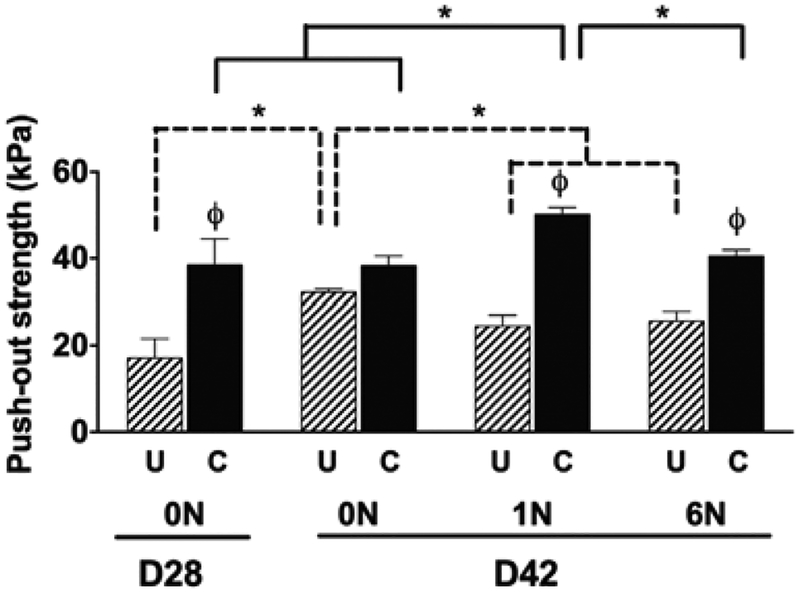
Figure 2.
Maximum push-out stress (kPa) as physically quantified at the end of static culture (D28) and after 14 days of no loading (0N), loading (1N and 6N) for unconfined (U) conditions and confined conditions (C) Data show average ± SEM of n = 12. ϕ indicates significant effects of boundary condition/confinement. * Indicates significant effects of loading.

