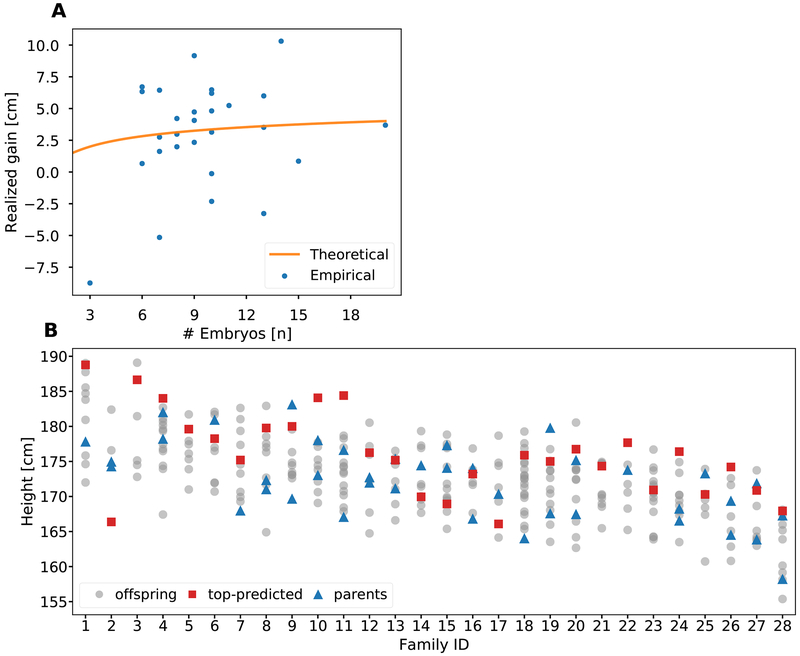
Figure 5. An analysis of selection for height in 28 real families with up to 20 adult offspring each.
(A) The realized gain in each family, defined as the difference between the actual (age- and sex-corrected) height of the offspring with the highest PS and the average height of all offspring in the family. The theoretical prediction is based on Eq. (1). (B) The actual height (age- and sex-corrected) of all members of all families. The figure demonstrates the effect of the current low-accuracy prediction models, as the tallest-predicted sibling (red squares) is usually not the actual-tallest sibling (only 7/28 times). Siblings are depicted as grey dots, and the parents of each family as blue triangles. In some families only one parent was available.

