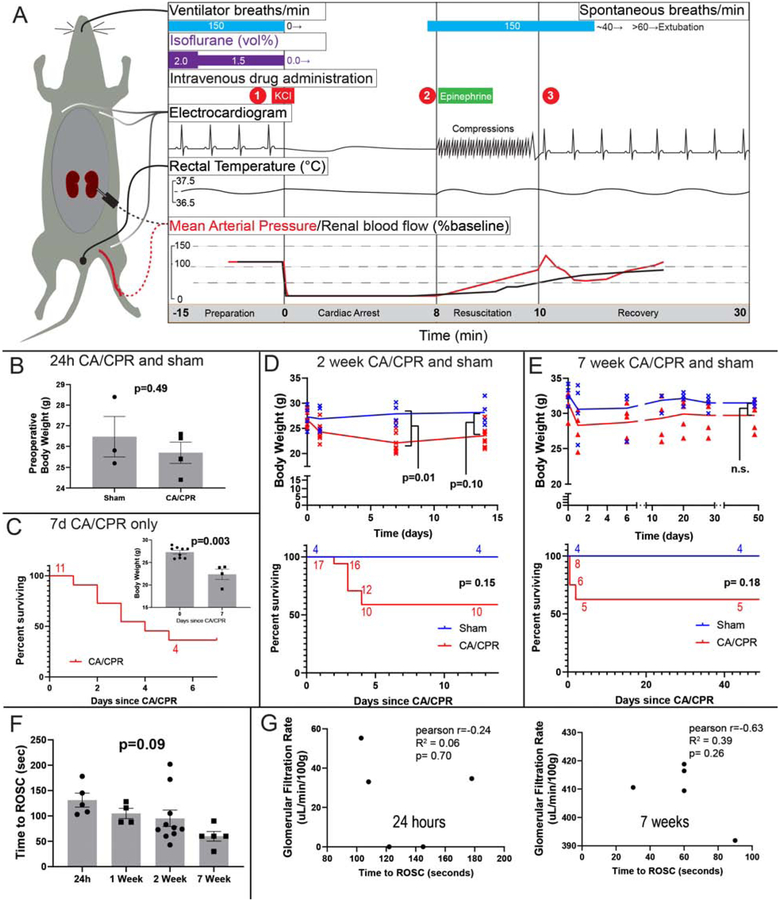
Figure 1:
Characteristics of cardiac arrest and cardiopulmonary resuscitation (CA/CPR) model and experiments. A. Summary of events and physiology during the cardiac arrest and cardiopulmonary resuscitation model in the mouse. During preparation the mouse is instrumented with an endotracheal tube, 3-lead electrocardiogram, right jugular PE-10 catheter, and rectal temperature probe in all experiments. Dotted lines denote renal cortex laser Doppler, and femoral arterial pressure catheter observations made in prior investigations (Hutchens et al 2010 and 2015, schematically reproduced, with approximate quantities, with permission). At (1) cardiac arrest is induced by administering potassium chloride (KCl), and the electrocardiogram demonstrates a sinusoidal, agonal rhythm. Immediately on cardiac arrest, mean arterial pressure drops to ~10% of baseline, and renal cortical blood flow to near zero. At (2), 8 minutes after KCl administration, chest compressions begin at a rate of 300/min, and epinephrine 8–16 μg administered intravenously over 30–60 seconds. Compression artifact is seen in the electrocardiogram. At (3) return of spontaneous circulation (ROSC) is observed in 90% of mice within 120 seconds. Hypertension (to ~125% baseline MAP) occurs in the 2 minutes following ROSC. Following resumption of adequate spontaneous respiration, by 15 minutes after ROSC, the endotracheal tube and other monitors are removed and the mouse is placed in a recovery cage. B-D Body weight and survival in independent experiments. B. Body weight was not different between sham and CA/CPR mice in the 24h experiment. C. Survival in the 7d CA/CPR cohort (this cohort does not have a respective sham group). Inset: body weight at start and end of the 7d experiment. D. Body weight and survival of CA/CPR and sham mice in the 2 week experiment. E. Body weight and survival of CA/CPR and sham mice in the 7 week experiment. F. The time to return of spontaneous circulation varies between mice, but not between groups. G: Scatter plots relate time to ROSC with GFR. Although the relationship is generally inverse, there is not significant correlation at 24h (note that GFR is near-zero 24h after CA/CPR) or at 7 weeks.

