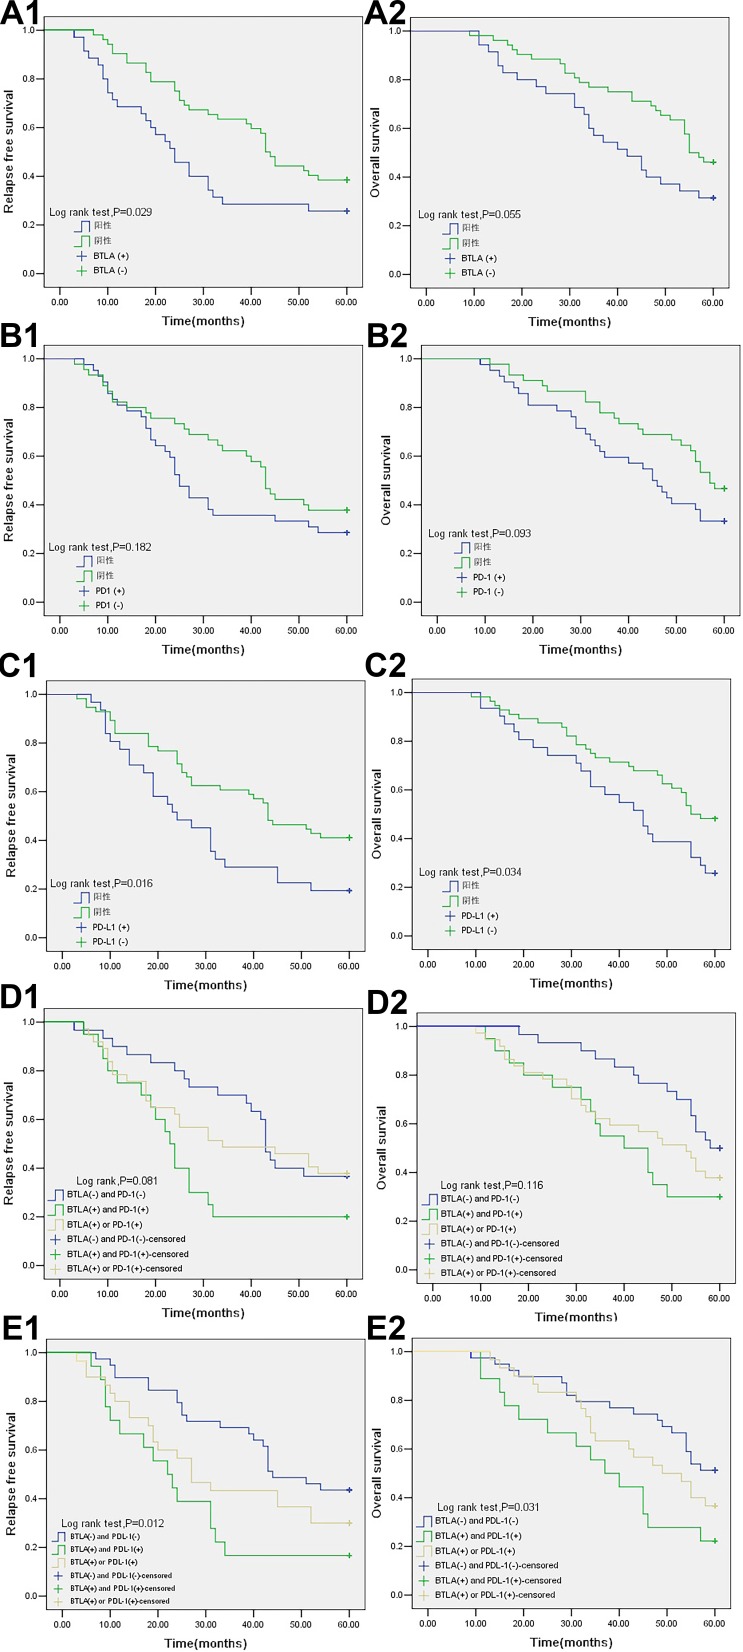
Figure 2.
Kaplan-Meier survival curves in patients with NSCLC. (A1) RFS of BTLA expression (P=0.029). (A2) OS of BTLA expression (P=0.055). (B1) RFS of PD-1 expression (P=0.182). (B2) OS of PD-1 expression (P=0.093). (C1) RFS of PD-L1 expression (P=0.016). (C2) OS of PD-L1 expression (P=0.034). (D1) RFS of BTLA and PD-1 expression (P=0.081). (D2) OS of BTLA and PD-1 expression (P=0.116). (E1) RFS of BTLA and PD-L1 expression (P=0.012). (E2) OS of BTLA and PD-L1 expression (P=0.031).
Abbreviations: NSCLC, non-small cell lung cancer; BTLA, B and T lymphocyte attenuator; PD-1, programmed death-1; PD-L1, programmed death ligand-1.

