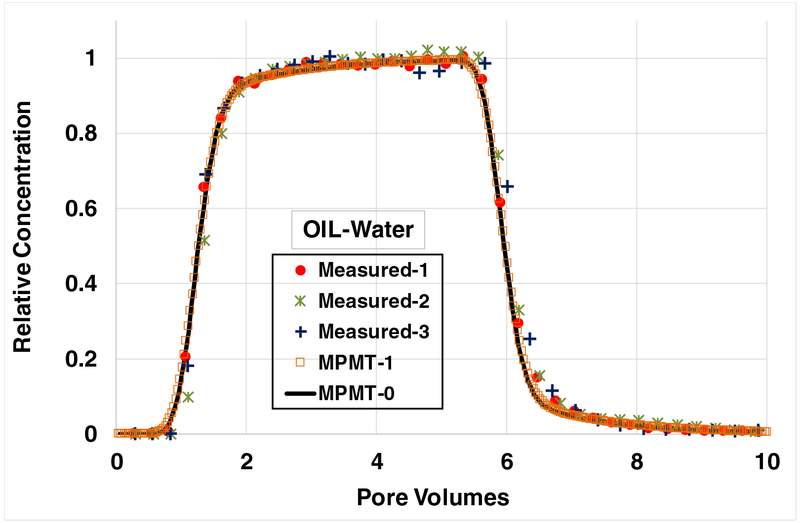
Figure 3.
Breakthrough curves for SDBS transport in columns containing trapped residual OIL, with adsorption at OIL-water interfaces contributing to retention. Both simulations incorporate rate-limited solid-phase adsorption. Case MPMT-0 represents local equilibrium (e.g., effectively “instantaneous”) OIL-water interfacial adsorption. Case MPMT-1 incorporates rate-limited OIL-water interfacial adsorption. Note that the input pulse was slightly larger for experiment 3, and therefore the simulated curve does not match the measured elution curve. SDBS injection concentration is ~40 mg/L; water saturation is 0.8.

