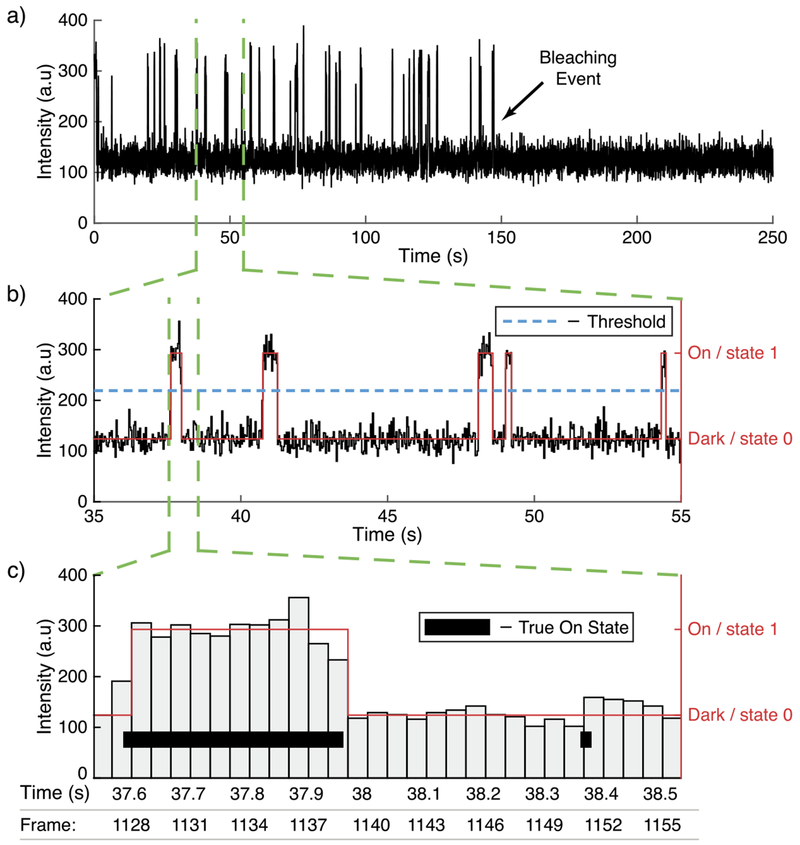
Fig. 3.
(a) A simulated intensity signal of a fluorophore across time. Each measurement corresponds to the intensity in a frame. 7500 frames were recorded over 250 seconds at a rate of 30 frames per second. (b) Close up of the signal over the time window of 35 s to 55 s. In red is the observed signal {Yn} indicating if the fluorophore was detected in a particular frame. (c) A further close up of the signal showing intensity read-outs for independent frames. The true, hidden photon emitting On state of the molecule is also indicated, demonstrating how sub-frame length photon emitting events can be missed due to noise or the temporal resolution of the data acquisition.

