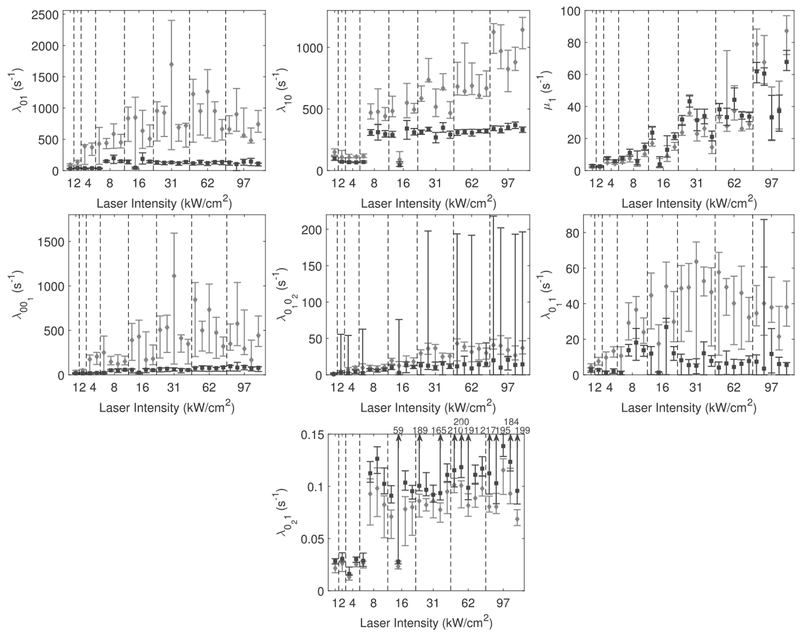
Fig. 9.
Rate predictions and associated 95% bootstrap confidence sets are shown for λ01, λ10, μ1, λ011, λ0102, λ011 and λ021, for eight different values of laser intensity (see Table 5 in the Appendix for exact experimental parameters). Intervals in black correspond to those from exponential fitting and those in gray correspond to those gained from the PSHMM. Point estimates from each of the 27 datasets are given by the diamond (PSHMM) or square (exponential). While in some cases PSHMM produces much wider intervals, it also yields less biased estimates than the exponential fitting method; see text for discussion.

