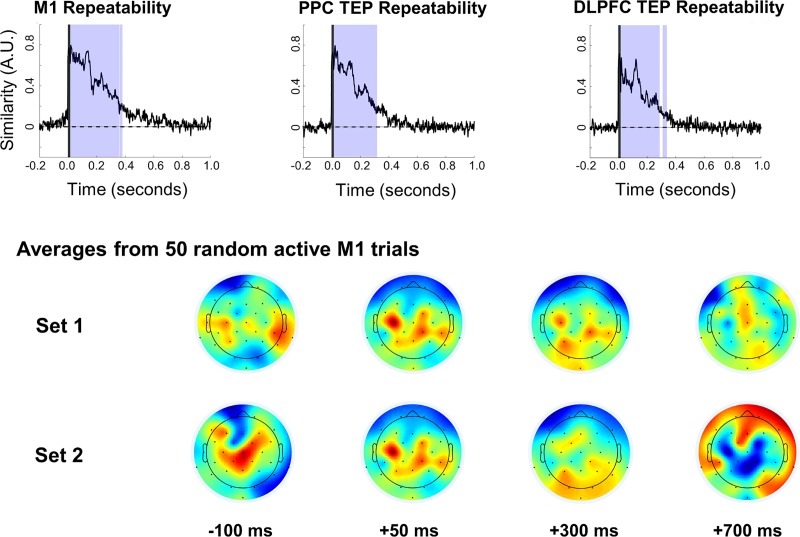
Fig 5.
Top: Group-level within-condition repeatability curves comparing within-participant and within-condition averages for active stimulation. The y-axis indicates arbitrary similarity units with a possible range of -1 to +1. Light Shading shows periods of significant difference from pre-stimulation baseline. The dark shaded regions from -1 ms to 15 ms indicate TMS pulse interpolation. Bottom: Plots show topographical distributions of two averages from active M1 stimulation, constructed using 50 non-overlapping trials each from one participant.

