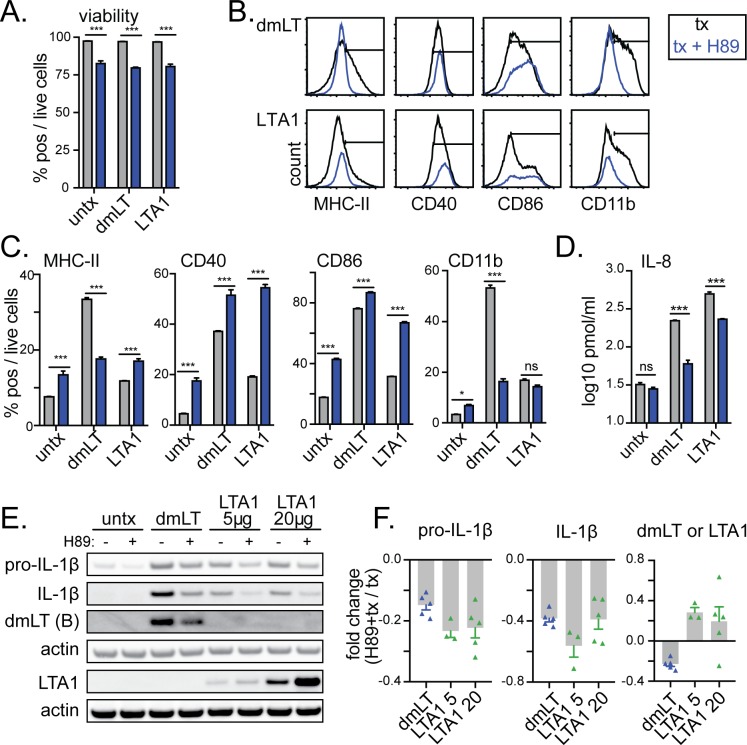
Fig 6. LTA1 and dmLT activation of APCs is partially prevented by PKA-inhibitor H89.
THP-1 cells were treated with media alone (untx), 1 μg/ml dmLT or 10 μg/ml LTA1 (unless otherwise indicated) treatments per 1x10⁶/ml cells (black lines or grey bars) or pre-incubated for 1h with 20 μM H89 prior to treatments (blue lines or bars). Cytometric samples and experiments performed in triplicate, cytokine analyses performed with triplicate samples. (A) Percentage of viable cells after 48h culture. (B) Representative histograms of activation markers MHC-II (HLA-DR), CD40, CD86, or CD11b after 48h culture with positive gates shown. (C) Percentage surface marker positive cells gated on live cells. (D) Secreted IL-8 detected in 24h culture supernatants. (E) Representative Western blots images for indicated protein bands using lysates of THP-1 cells incubated with PMA for 12h and then media or H89 for 1 h prior to 1 μg/ml dmLT or 5–20 μg/ml LTA1 treatments as indicated. (F) Fold change from H89 + treatment using relative intensity of protein bands normalized to actin compiled from 3–5 separate experiments. Significance tested by two-way ANOVA with Bonferroni post-test between selected pairs as indicated (*P ≤ 0.05, ***P ≤ 0.001). Bars at mean+SEM.

