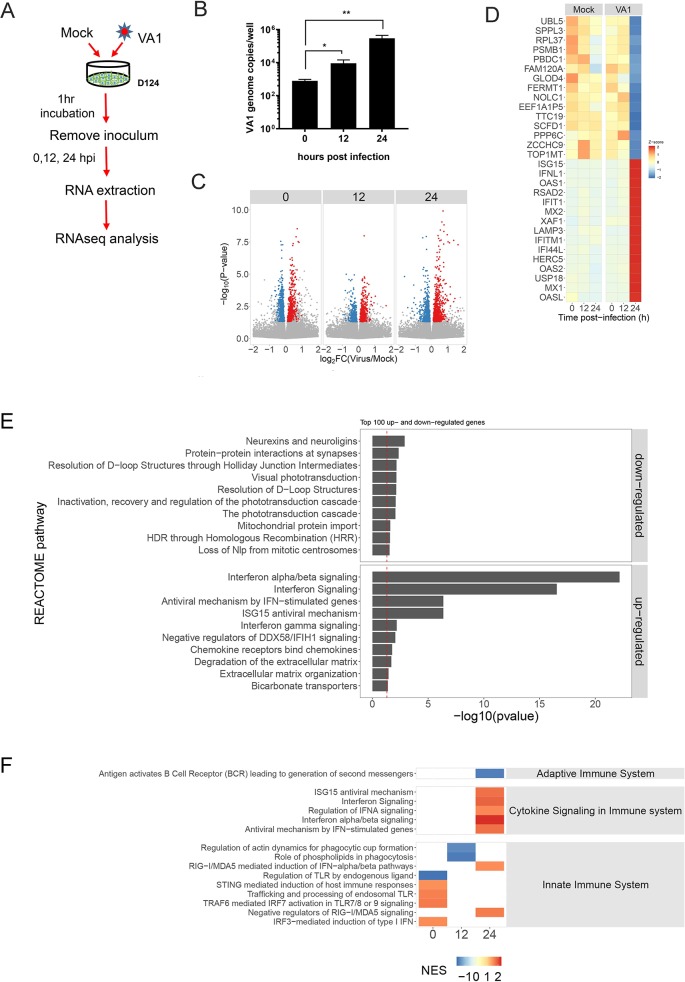
Fig 4. Transcriptional profiling of VA-1 infected HIE by RNA-seq.
A) Experimental design of the RNA-seq experiment. N = 3 for each time point. B) VA1 titers of infected undifferentiated D124 HIE measured by RT-qPCR at the indicated times. *P<0.05; **P<0.01. C-D) Host response to VA1 infection by RNA-seq. C) Log2 fold change in normalized expression (transcripts per million reads) of all expressed host genes of VA1-infected HIEs relative to mock-infected HIEs at 0, 12, and 24 hpi (Volcano plot). The y-axis shows the -log10 transformed P-value. Genes significantly up-regulated (P < 0.05) in VA1-infected HIEs relative to mock-infected HIEs are colored red and significantly down-regulated genes are colored blue. D) Heat map of the top 15 up- and down-regulated genes (Z-score) in VA1-infected HIEs relative to mock-infected HIEs at indicated time points post-infection. E) The pool of genes that were significantly up- or down-regulated in VA1-infected HIEs relative to mock-infected HIEs were evaluated for enrichment of REACTOME pathway analysis using an over-representation test. The top 10 significantly over-represented pathways among both the up- and down-regulated gene sets are shown. F) Differentially expressed genes were ranked according to the log2 fold change between VA1-infected HIEs and mock-infected HIEs and analyzed for coordinated gene expressed within REACTOME pathways using Gene Set Enrichment Analysis. The heat map shows conditions in which the normalized enrichment score (NES) differs significantly (P < 0.05) from random variation, indicating a trend towards coordinated up- or down-regulated expression of genes within a pathway.

