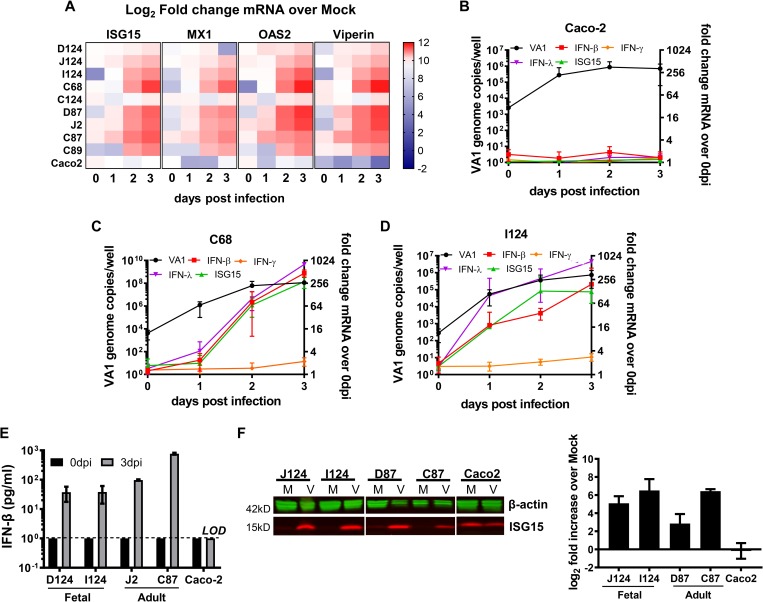
Fig 5. HIEs mount interferon responses to VA1 infection.
A) Heat map of ISG15, MX1, OAS2 and Viperin (RSAD2) mRNA fold increase over mock during VA1 infection of HIE derived from different human intestinal segments and Caco-2 cells. B-D) Timecourse of IFN-β, IFN-γ, IFN-λ and ISG15 mRNA expression in VA1 infected Caco-2 cells (B), C68 HIE (C), and I124 HIE (D). VA1 infected cells were harvested at selected dpi and cellular RNA was extracted for VA1 quantification by RT-qPCR (left y-axis) and for the remaining transcripts quantification as fold increase over 0 dpi by qPCR (right y-axis). GADPH was used as internal control. E) IFN-β is secreted during VA1 infection in HIE but not in Caco-2 cells. D124, I124, D87, J2 and Caco-2 cells were infected with VA1 or mock infected (MOI of 1). Supernatants were collected at 3 dpi and ELISA was used to measure IFN- β. F) Mock and VA1-infected HIE and Caco-2 cells lysates were collected at 3 dpi. ISG15 protein levels were analyzed and quantified by Western blot using the secondary LI-COR fluorescent antibodies. Βeta-actin was used as internal control. Images were acquired with LI-COR Odyssey Imager and quantified with ImageJ software for the densitometry analysis. Representative blots are shown on the left for fetal (J124 and I124) and adult (D87 and C87) VA1 infected HIE. Quantification of the data is shown on the right. N ≥ 3; error = mean ± SD. Abbreviations: D = duodenum, J = jejunum, I = ileum, C = colon, M = mock infection, V = VA1 infection. The numbers indicate patient identifiers. *P<0.05; ***P<0.001; ND = not detected; LOD = limit of detection.

