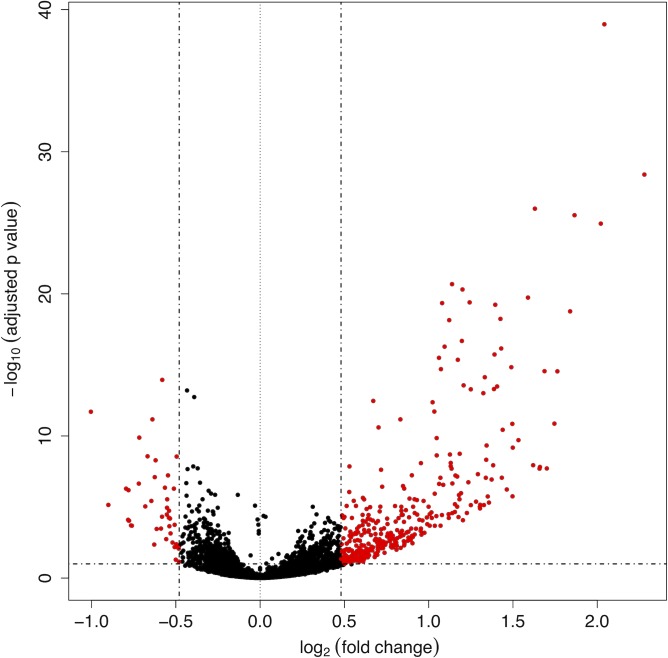
Fig 5. Volcano plot shows the gene statistical significance (on the y-axis) over the log2 fold change after normal shrinkage (on the x-axis) for all the samples from differential expression analysis between anti-miR-71-2´OMe vs scramble-2´OMe control.
Red points correspond to 416 differentially expressed transcripts (372 up-regulated, in the right of the plot) with an adjusted p-value less than 0.1 and an absolute log2 fold change above 0.48.

