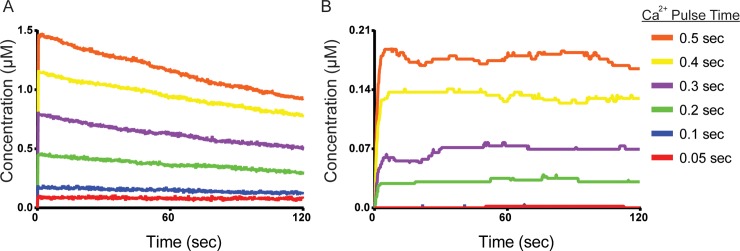
Fig 4. Response to short Ca2+/CaM pulse stimulation.
Average concentration of (A) active and (B) pThr-286 CaMKII subunits over time, following Ca2+/CaM stimulating pulses of length 0.05 (red), 0.1 (blue), 0.2 (green), 0.3 (purple), 0.4 (yellow), and 0.5 (orange) seconds. Each trace represents the average of N = 50 executions. See Fig C in S1 Appendix for identical data shown with SEM error bars and over the first two seconds of simulated time. As detailed in Methods, the CaM concentration is here 22.8μM (450 particles).

