
Fig 5. Blocking kinase or phosphatase activity.
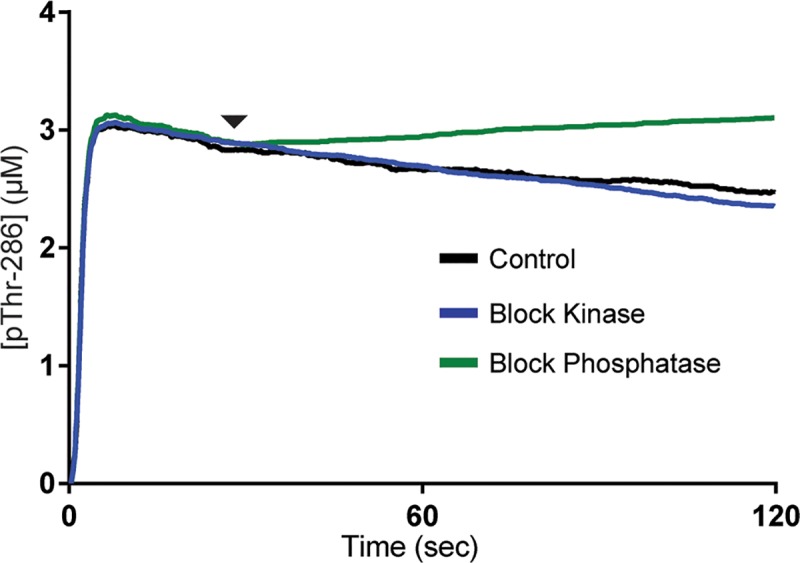
Average concentration of pThr-286 CaMKII subunits over time. For all traces, the model is stimulated by a 2 sec pulse of Ca2+/CaM. At time t = 30 sec (arrowhead), either a kinase inhibitor (blue trace) or phosphatase inhibitor (green trace) is introduced. No inhibitor is introduced in the control (black trace). Each trace represents the average of N = 50 executions.