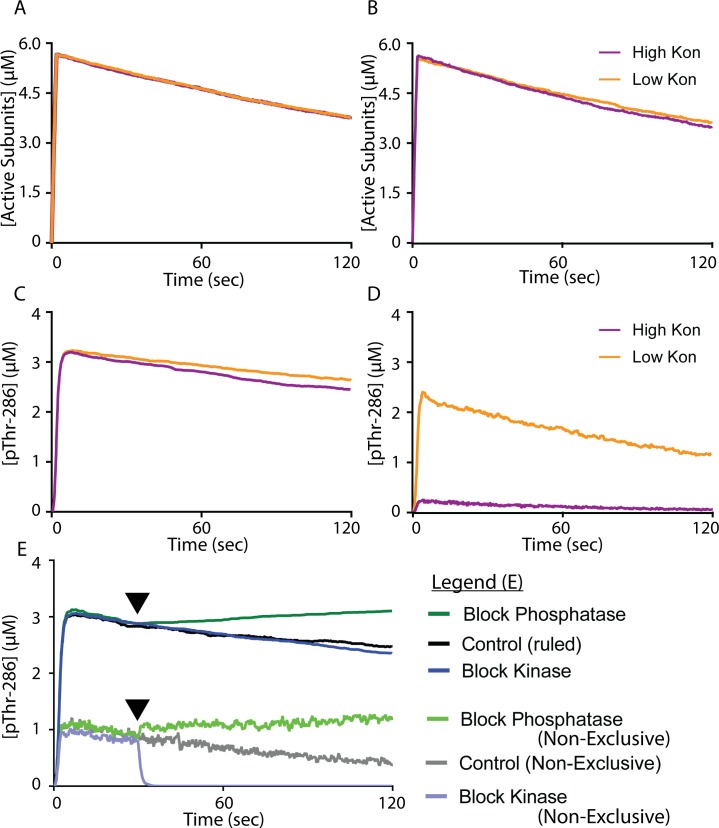
Fig 6. Comparison of Exclusive and Non-exclusive Models.
For all traces, models are stimulated by a 2sec pulse of Ca2+/CaM. (A) Active CaMKII subunits over time in our exclusive model. (B) Active CaMKII subunits over time in our non-exclusive model. (C) pThr-286 subunits over time in our exclusive model. (D) pThr-286 subunits over time in our non-exclusive model. (A-D) The parameter value for the rate of PP association (konPP1) with CaMKII is either increased (purple traces) or decreased (orange traces) by one order of magnitude. (E) Extension of Fig 5 to include non-exclusive model results; the exclusive model results are also shown in Fig 5. At time t = 30sec (arrows), either a kinase inhibitor (light blue trace) or phosphatase inhibitor (light green trace) is introduced. No inhibitor is introduced in the control (grey trace). All traces are the average of N = 50 executions.

