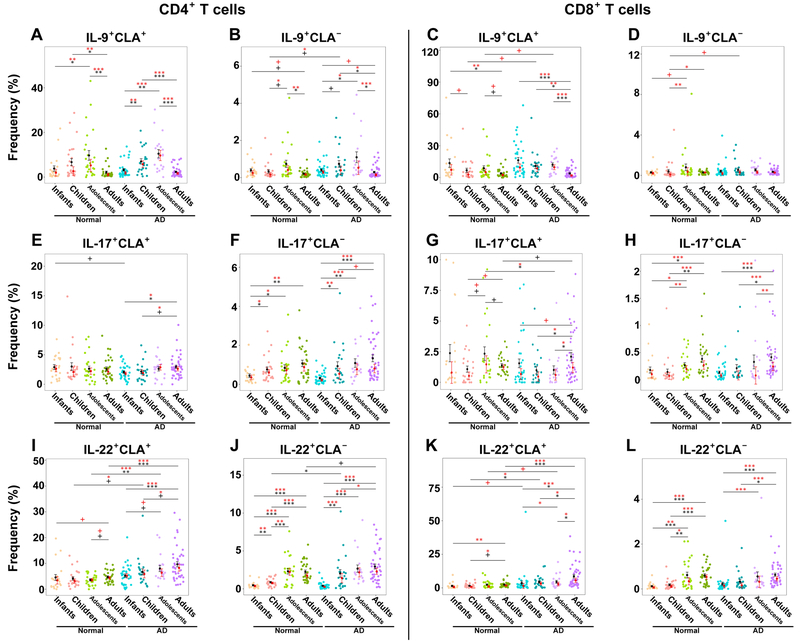
Figure 3.
A-D) IL-9+ and (E-H) IL-17+ and (I-L) IL-22+ frequencies in CLA+, CLA−, CD4+ and CD8+ T-cells in healthy controls and AD patients across ages. Bar plots represent means (black)/medians (red) ± SEMs. AD, Atopic dermatitis; CLA, Cutaneous lymphocyte antigen; SEM, Standard error of the mean/median. P-values are designated as ***<0.001, **<0.01, *<0.05, and +<0.1.

