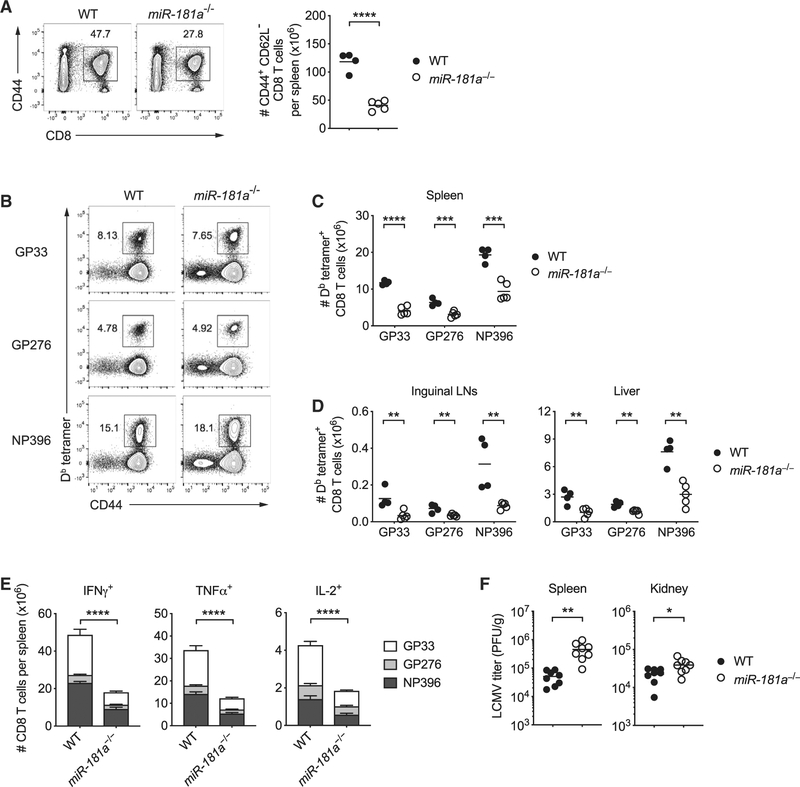
Figure 1. miR-181a Deficiency Impairs Antigen-Specific CD8 T Cell Expansion and Viral Clearance after LCMV Infection.
dLck-Cre+ Rosa26YFP miR-181ab1+/+ (WT) and dLck-Cre+ Rosa26YFP miR-181ab1fl/fl (miR-181a−/−) mice were infected with LCMV-Armstrong; CD8 T cell responses were analyzed on day 8.
(A) Representative flow plots of CD44+ splenic CD8 T cells (left) and summary data of the total numbers of YFP+ CD44+ CD62L– CD8 T cells in the spleen from one experiment (right).
(B) Representative flow plots of Db LCMV GP33–41 (GP33), Db GP276–286 (GP276), and Db NP396–404 (NP396) tetramer+ cells gated on YFP+ CD8 T cells in the spleen of WT and miR-181a−/− mice.
(C and D) YFP+ CD8 T cells specific for the indicated epitopes in the spleen (C) and inguinal lymph nodes and liver (D).
(E) Splenocytes were restimulated with GP33, GP276, or NP396 peptides. Stacked bar graphs show the numbers of cytokine-producing YFP+ CD8 T cells (mean ± SEM).
(F) Viral titers in the spleen and kidney on day 6 after LCMV infection.
Data are representative of three independent experiments with 4–5 mice per group (A–C and E), one experiment with 4–5 mice per group (D), or pooled from two independent experiments with 8 mice per group (F). Unless stated otherwise, data are presented as means. Statistical significance by two-tailed unpaired t test (A, C, D, and F) or two-way ANOVA followed by Tukey’s post-test comparison (E). *p < 0.05; **p < 0.01; ***p < 0.001; ****p < 0.0001. See also Figure S4.

