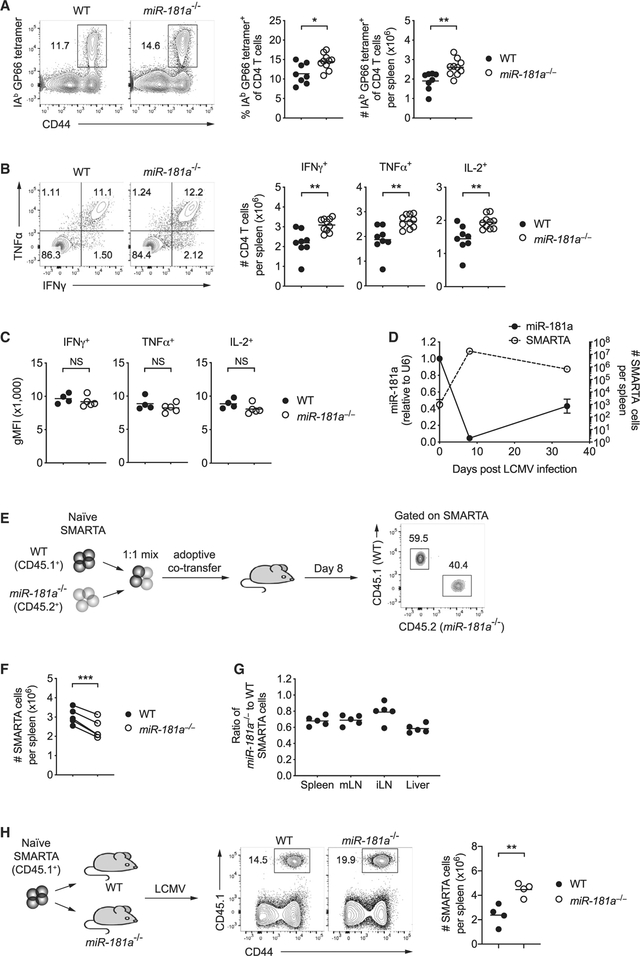
Figure 2. Antiviral CD4 T Cell Responses in miR-181a−/− Mice.
(A–C) WT and miR-181a−/− mice were infected with LCMV; CD4 T cell responses were analyzed on day 8. (A) Representative flow plots for IAb GP66 tetramer+ cells gated on YFP+ CD4 T cells (left) and summary data of the frequencies and numbers of IAb GP66 tetramer+ YFP+ CD4 T cells in the spleen (right). (B) Representative flow plots of IFNγ and IFNα production by YFP+ CD4 T cells after restimulation with GP61 peptide (left) and summary data of cytokine-producing YFP+ CD4 T cells in the spleen (right). (C) Summary data of cytokine expression on a per-cell basis in day 8 effector CD4 T cells.
(D) Naive SMARTA CD4 T cells (CD45.1+) were adoptively transferred into B6 hosts (CD45.2+), followed by LCMV infection 1 day later. Graph shows the number of splenic SMARTA CD4 T cells and miR-181a levels on sorted SMARTA cells at indicated time points (mean ± SEM).
(E–G) Equal numbers of congenically marked WT and miR-181a−/−YFP+ SMARTA CD4 T cells were co-transferred into B6 mice that were infected with LCMV 1 day later. (E) Schematic diagram (left) and representative flow scatter plots of the relative proportion of WT and miR-181a−/− SMARTA CD4 T cells in the spleen (right). (F) Summary graph of the number of splenic WT and miR-181a−/− SMARTA CD4 T cells on day 8 from one experiment. (G) Ratios of miR-181a−/− to WT SMARTA CD4 T cells in the spleen, mesenteric lymph nodes (mLNs), inguinal lymph nodes (iLNs), and liver.
(H) Equal numbers of WT SMARTA cells (CD45.1+) were transferred into WT mice and mice with miR-181a-deficient T cells (schematic diagram, left), followed by LCMV infection 1 day later. Representative contour plots of expanded SMARTA cells gated on total CD4 T cells in WT and miR-181a−/− recipients (middle) and frequencies from four mice in each group on day 8 (right).
Data are pooled from two independent experiments with 8–10 mice per group (A and B), representative of two independent experiments with 4–5 mice per group (C and E–G) or one experiment with 3–4 mice per group (D and H). Unless stated otherwise, data are presented as means. Statistical significance by two-tailed unpaired (A–C and H) or paired (F) t test. *p < 0.05; **p < 0.01; ***p < 0.001; NS, not significant. See also Figure S5.

