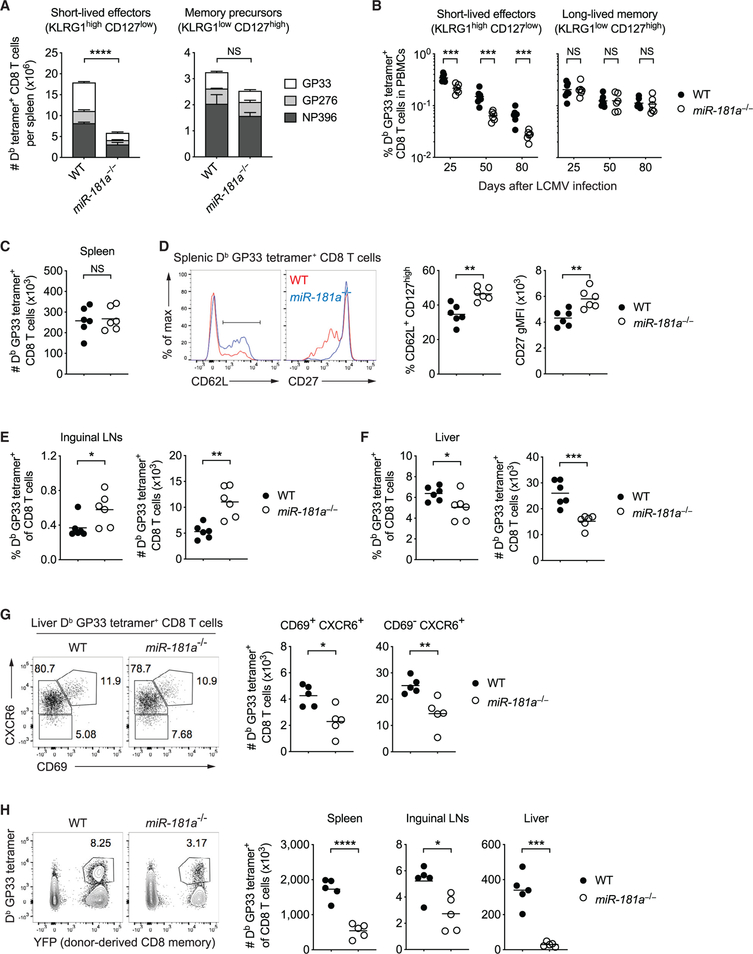
Figure 4. miR-181a Is Required for the Generation of Short-Lived Effector and Long-Lived Liver-Residing Memory CD8 T Cells.
(A) WT and miR-181a−/− mice were infected with LCMV, and their spleens were harvested on day 8. Stacked bar graphs of the numbers of short-lived effector (KLRG1high CD127low, left) and memory precursor (KLRG1low CD127high, right) Db tetramer+ YFP+ CD8 T cells for indicated epitopes (mean ± SEM).
(B) Frequencies of Db GP33 tetramer+ YFP+ CD8 T cells with a short-lived effector (left) or a long-lived memory phenotype (right) in peripheral blood mononuclear cells (PBMCs) at indicated time points.
(C–F) Antigen-specific memory CD8 T cells on day 85 after infection. Number of Db GP33 tetramer+ YFP+ CD8 T cells in the spleen (C), and representative histograms and dot plots of CD62L and CD27 expression by Db GP33 tetramer+ YFP+ CD8 T cells (D). Frequencies and numbers of Db GP33 tetramer+ YFP+ CD8 T cells in inguinal lymph nodes (E) and liver (F).
(G) CD69 and CXCR6 expression on liver-resident GP33-specific CD8 T cells on day 50.
(H) GP33-specific YFP+ memory CD8 T cells from WT and miR-181a−/− mice were transferred into B6 hosts infected with LCMV 1 day later. Representative flow plots of the frequency of donor-derived Db LCMV GP33 tetramer+ cells gated on total CD8 T cells in the spleen (left) and dot plots of the total numbers of Db LCMV GP33 tetramer+ CD8 T cells in the spleen, lymph nodes, and liver (right).
Data are representative of three independent experiments with 4–5 mice per group (A), pooled from two independent experiments with 6–7 mice per group (B–F) or one experiment with 5 mice per group (G and H). Unless stated otherwise, data are presented as means. Statistical significance by two-way ANOVA followed by Tukey’s post-test comparison (A) or two-tailed unpaired t test (B–H). *p < 0.05; **p < 0.01; ***p < 0.001; ****p < 0.0001; NS, not significant. See also Figures S6 and S7.

