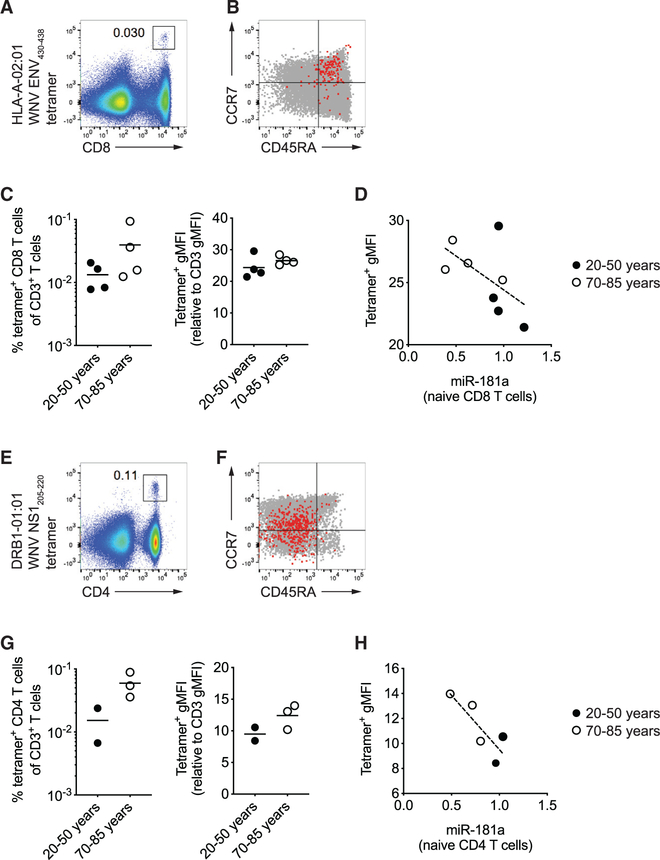
Figure 6. Characterization of West Nile Virus-Specific CD4 and CD8 Memory T Cells in Young and Old Adults.
Tetramer staining for West Nile virus (WNV)-specific T cells in PBMC from individuals who acquired infection at young or old age.
(A) Representative scatter plot of HLA-A2-restricted Env430–438 tetramer+ CD8 T cells gated on CD3+ T cells.
(B) CD45RA and CCR7 expression by WNV-specific CD8 T cells (red) and total CD8 T cells (gray).
(C) Frequencies of tetramer+ CD8 T cells among CD3+ T cells and MFI of tetramer relative to CD3 staining from four 20- to ~50-year-old and four 70- to ~85-year-old individuals. Horizontal lines in dot plots indicate the means.
(D) miR-181a levels in naive CD8 T cells (young closed circle, old open circle) are plotted versus tetramer MFI from (C). Dotted line indicates the best fit by linear regression.
(E) Representative scatter plot of DRB1*01:01 restricted NS1205–220 tetramer+ CD4 T cells gated on CD3+ T cells.
(F) CD45RA and CCR7 expression of WNV-specific CD4 T cells (red) and total CD4 T cells (gray).
(G) Frequencies of DRB1*01:01 or DRB1*04:01 tetramer+ cells among CD3+ T cells and MFI of tetramer relative to CD3 staining from two young and three older individuals. Horizontal lines in dot plots indicate the means.
(H) miR-181a levels in naive CD4 T cells (young closed circle, old open circle) are plotted versus tetramer MFI from (G). Dotted line indicates the best fit by linear regression.

