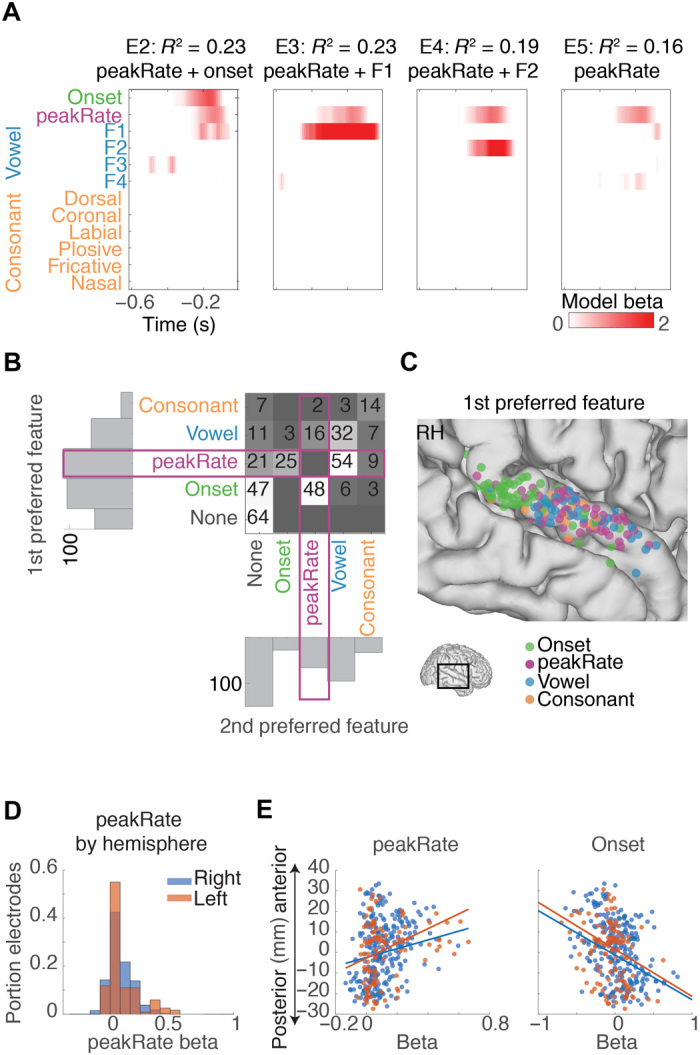
Fig. 4. Independent and joint encoding of peakRate and other speech features.

(A) Linear weights from an encoding model with phonetic features and peakRate events for four example electrodes. Different electrodes show encoding of different features alongside peakRate. (B) Number of electrodes with different combinations of the two significant features with the largest linear weights across STG electrodes. Vowel formant predictors (blue) and consonant predictors (orange) are each combined for visualization purposes. Onset and peakRate are blank along the diagonal because they contain one predictor only. peakRate encoding co-occurs with different phonetic features [e.g., E2 to E4 in (A)] but can also occur in isolation [E5 in (A)]. (C) Anatomical distribution of electrodes with primary encoded onset, peakRate, vowel, or consonant features across all right hemisphere electrodes. Onset encoding is clustered in posterior STG, and peakRate encoding is predominant in middle STG. RH, right hemisphere. (D) Distribution of model beta values for peakRate in left and right hemisphere. (E) Left: Correlation between electrode position along STG and peakRate beta. Right: Correlation between electrode positions along STG and onset beta. Onset beta values are largest in posterior STG, and peakRate beta values are largest in middle STG.
