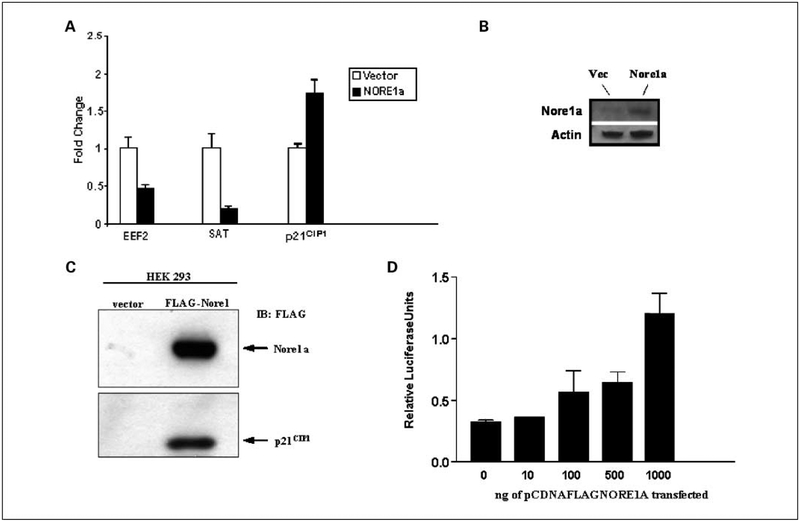
Figure 1.
A, qRT-PCR validation. qRT-PCR analysis was performed on the induced cells for EEF2, SAT1, and p21CIP1. Values for the vector were normalized to 1, and the fold change due to NORE1A was plotted. The results confirmed the microarray results. B, protein expression of NORE1A in the induced cells. C, NORE1A induces p21CIP1 protein expression. HEK-293 cells were transfected with pcDNAFLAG NORE1A or empty vector. After 24 h, the cells were lysed, and equal amounts of protein lysate were Western blotted for exogenous NORE1A (FLAG) and endogenous p21CIP1. D, increasing amounts of pcDNAFLAG NORE1A expression plasmid were transfected into NIH 3T3 cells with a p21-luciferase reporter and a Renilla-luciferase internal control plasmid, essentially as described previously (45).

