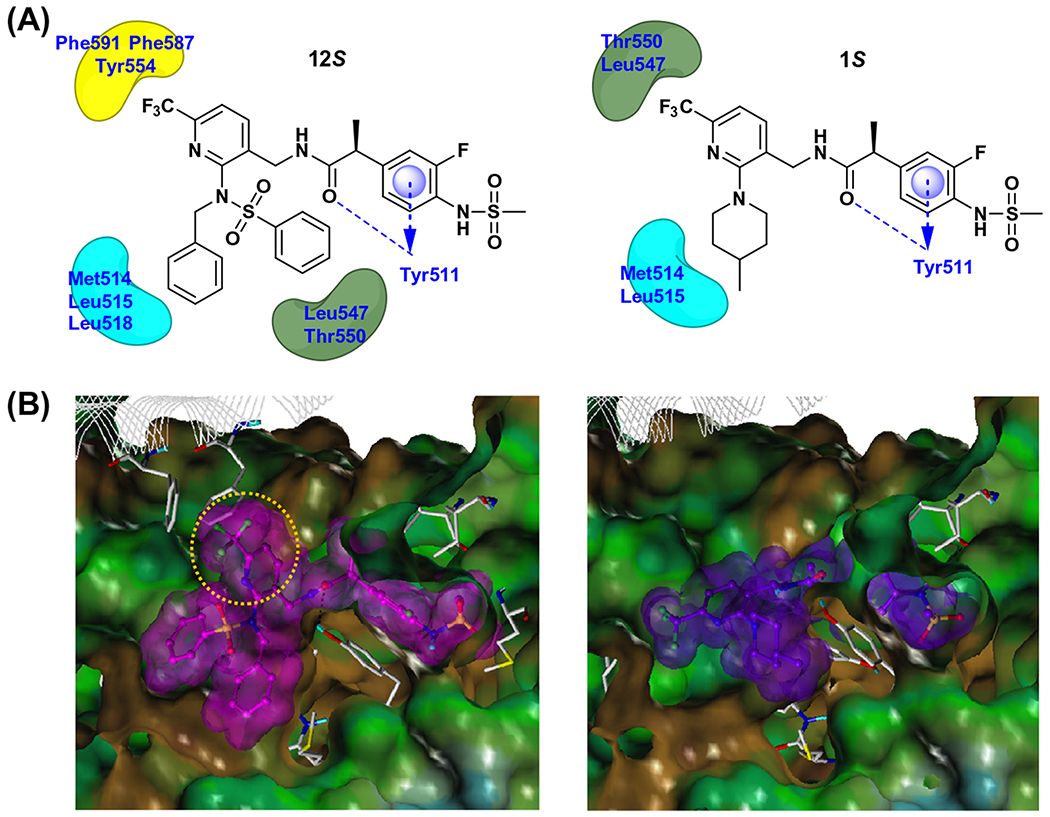
Figure 3.
Docking analysis of 12S and 1S in the hTRPV1 homology model. (A) 2-D representation of the interactions between 12S (left) and 1S (right) with hTRPV1. Hydrogen bonding interactions are depicted as blue dashed lines and hydrophobic interactions are shown as arcs. The π–π stacking interaction is marked with a blue disc and arrow. (B) The Fast Connolly surface of hTRPV1 and the van der Waals surface of the docked compounds. MOLCAD was used to create the molecular surface of hTRPV1 and the surface is displayed with the lipophilic potential property. The surface of hTRPV1 is Z-clipped for clarity and that of ligands are colored individually by magenta or purple. The yellow colored circle represents the part of 12S which is involved in the additional hydrophobic interactions.

