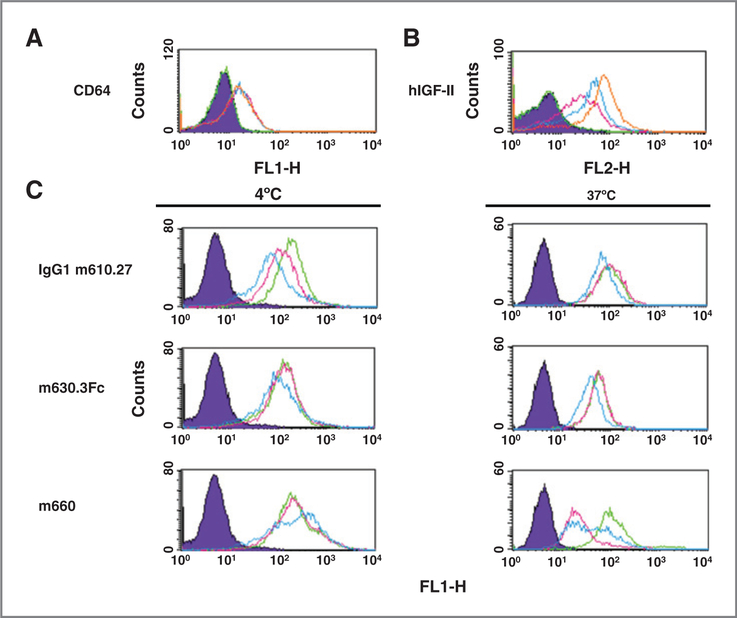
Figure 6.
FACS binding of m660–hIGF-II complexes to PMA-stimulated U937 cells. A, expression of FcγRI on U937 cells. The diagram for reference cells that were not stimulated is in purple. The diagram for cells mock-stimulated with PMA solvent dimethyl sulfoxide (DMSO) is in green. The pink, blue, and orange diagrams are for cells stimulated with 10, 20, and 30 ng/mL PMA, respectively. B, binding of biotinylated hIGF-II to U937 cells. The green diagram indicates cells incubated with streptavidin-PE conjugate only. The diagrams for cells incubated with hIGF-II at concentrations of 10, 100, and 1,000 nmol/L are in pink, blue, and orange, respectively. C, interactions of antibody–hIGF-II complexes with U937 cells. The purple diagram is for reference cells incubated with the secondary antibody only. The diagrams for cells incubated with 10 nmol/L antibody alone, 10 nmol/L antibody plus 20 (for monospecific antibodies), or 40 nmol/L (for m660) hIGF-II, and an combination of the antibody, hIGF-II, and 50 μmol/L cytochalasin D are in green, pink, and blue, respectively.

