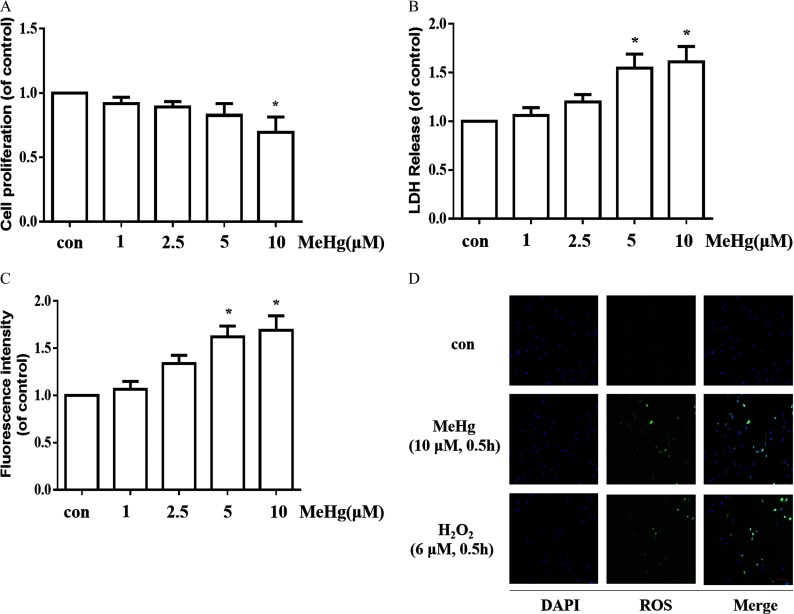
Figure 1.
Cell proliferation, cytotoxicity and ROS production after treatment with MeHg for in astrocytes. (A) Cell proliferation in astrocytes was measured using the MTT assay. (B) Cytotoxicity in astrocytes was detected via LDH release. (C) Effects of MeHg treatment on ROS production using the fluorescent probe DCFH-DA. The fluorescence intensity was detected by the microplate reader. (D) Representative images for ROS generation induced by MeHg (, ) treatment. . (, ) was set as a positive control for ROS generation. Green fluorescence indicates ROS and blue (DAPI) indicates the nucleus. Note: Data are presented as from three independent experiments (). con, control (culture medium treatment without MeHg); DAPI, 4′,6-diamidino-2-phenylindole; DCFH-DA, 2′,7′-dichlorofluorescin diacetate; , hydrogen peroxide; LDH, lactate dehydrogenase; MeHg, methylmercury; MTT, 3-(4,5-dimethylthiazol-2-yl)-2,5-diphenyl diphenyltetrazolium bromide; ROS, reactive oxygen species. * vs. control by one-way analysis of variance (ANOVA) with Dunnett’s post hoc test.

