. 2019 Dec 18;127(12):127006. doi: 10.1289/EHP5139

Figure 2.

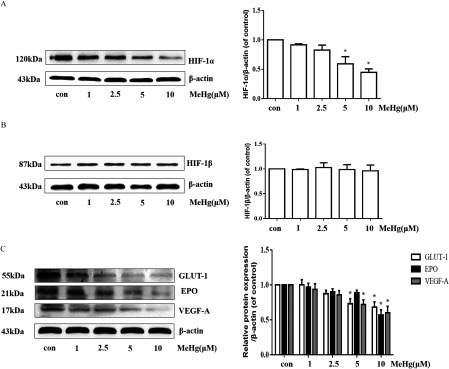
Figure 2A comprises a Western blotting for HIF 1 alpha (120 kilo Dalton) and beta actin (43 kilo Dalton) and a bar graph with standard deviation plotting HIF 1 alpha or beta actin (y-axis) across treatment with 0, 1, 2.5, 5, and 10 micromolar of methylmercury (x-axis). Figure 2B comprises a Western blotting for HIF 1 beta (87 kilo Dalton) and beta actin (43 kilo Dalton) and a bar graph with standard deviation plotting HIF 1 beta or beta actin (y-axis) across treatment with 0, 1, 2.5, 5, and 10 micromolar of methylmercury (x-axis). Figure 2C comprises a Western blotting for GLUT 1 (55 kilo Dalton), EPO (21 kilo Dalton), VEGF A (17 kilo Dalton), and beta actin (43 kilo Dalton), as well as a bar graph with standard deviation plotting relative protein expression per beta actin (y-axis) across treatment with 0, 1, 2.5, 5, and 10 micromolar of methylmercury (x-axis).

Effects of MeHg on the expression of HIF-1αrelated proteins in astrocytes. (A) Western blotting for HIF-1α in astrocytes following MeHg (0, 1, 2.5, 5 or 10μM, 0.5h) exposure. (B) Western blotting for HIF-1β in astrocytes following MeHg (0, 1, 2.5, 5, or 10μM, 0.5h) exposure. (C) Effect of MeHg (0, 1, 2.5, 5, or 10μM, 0.5h) exposure on the expression of the downstream proteins of HIF-1α, including GLUT-1, EPO, and VEGF-A. β-actin was used as the internal control. Note: Data are presented as mean±SD from three independent experiments (n=3). con, control (culture medium treatment without MeHg); EPO, erythropoietin; GLUT-1, glucose transporter 1; HIF-1α, Hypoxia-inducible factor-1α; HIF-1β, Hypoxia-inducible factor-1β; MeHg, methylmercury; VEGF-A, vascular endothelial growth factor A. *p<0.05 vs. control by one-way ANOVA with Dunnett’s post hoc test.