. 2019 Dec 18;127(12):127006. doi: 10.1289/EHP5139

Figure 5.

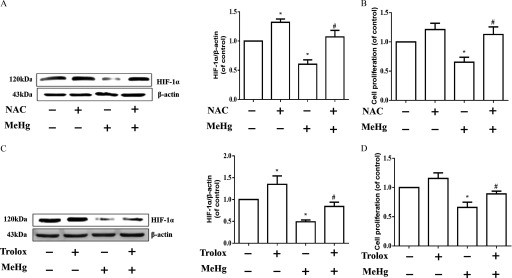
Figure 5A comprises a Western blotting for HIF 1 alpha (120 kilo Dalton) and beta actin (43 kilo Dalton) and a bar graph with standard deviation plotting HIF 1 alpha or beta actin (of control; y-axis) across treatment with NAC and micromolar of methylmercury (x-axis). Figure 5B is a bar graph plotting cell proliferation (of control; y-axis) across treatment with NAC and micromolar of methylmercury (x-axis). Figure 5C comprises a Western blotting for HIF 1 alpha (120 kilo Dalton) and beta actin (43 kilo Dalton) and a bar graph with standard deviation plotting HIF 1 alpha or beta actin (of control; y-axis) across treatment with Trolox and micromolar of methylmercury (x-axis). Figure 5D is a bar graph plotting cell proliferation (of control; y-axis) across treatment with Trolox and micromolar of methylmercury (x-axis).

HIF-1α protein expression and cell proliferation after pre-treatment with antioxidants in MeHg-treated astrocytes. (A) Effect of NAC pretreatment (2.5  mM, 4h) on HIF-1α protein expression. (B) Effect of NAC pretreatment on the decreased cell proliferation induced by MeHg. (C) Effect of Trolox pretreatment (2.5  mM, 4h) on HIF-1α protein expression. (D) Effect of Trolox pretreatment on the MeHg-induced decrease in cell proliferation. Note: Statistical analysis was performed by one-way ANOVA with Tukey’s post hoc test. Data are presented as the mean±SD from three independent experiments (n=3). con, control (culture medium treatment without MeHg); HIF-1α, Hypoxia-inducible factor-1α; MeHg, methylmercury; MTT, 3-(4,5-dimethylthiazol-2-yl)-2,5-diphenyl diphenyltetrazolium bromide; NAC, N-acetyl-cysteine, Trolox, 6-hydroxy-2,5,7,8-tetramethylchroman-2-carboxylic acid. *p<0.05 vs. control, #p<0.05 vs. MeHg-only group.