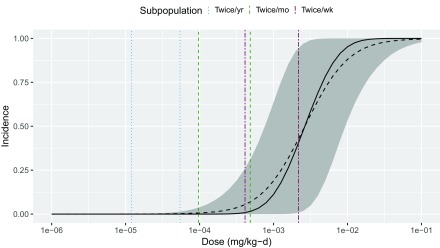
Figure 1.
Noncancer PCB dose–response relationship corresponding to a 50% decrease in immunoglobulin M. Curved (black) . Curved (black) . Surrounding (dark gray) confidence interval. Vertical (colored) dashed confidence intervals of average daily doses (mg/kg-d) for three subpopulations: Upper Hudson anglers and their family members consuming fish at frequencies of a) twice per year, b) twice per month, and c) twice per week during the 2004–2009 timeframe.

